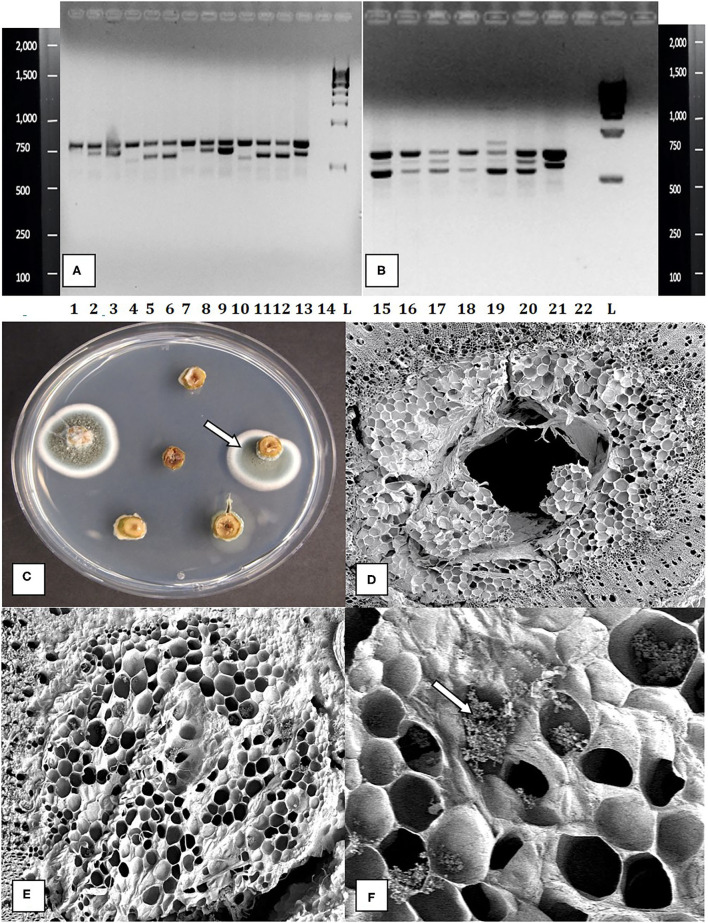
Figure 5.
Molecular detection and identification of tissue culture contaminants. (A,B) PCR detection of fungal DNA present in naturally contaminated nodal explants. Upper bands at 750 bp size are plant DNA. Lower bands at ca. 650 bp are fungal DNA. These bands were cut and sequenced to determine the corresponding fungus present. Lanes 1–13 (lower bands) are as follows: clean, Simplicillium lasoniveum, Trichoderma harzianum. Clean, Beauveria bassiana, Fusarium oxysporum. Clean, Trametes versicolor, Lecanicillium fungicola, Chaetomium globosum, F. oxysporum, F. oxysporum, L. fungicola. Lane 14 = water control. L = molecular weight standards. Lanes 15–21 (lower bands) = Penicillium chrysogenum, Penicillium copticola, C. globosum, Penicillium olsonii, P. olsonii, T. versicolor. Lane 22 = water control, L= molecular weight standards. (C) Growth of Penicillium colonies emerging from the center of pith tissues in cut nodal segments. (D) Cross-section of a cannabis nodal stem explant showing the central pith surrounded by pith cells. (E) Close-up of pith cells as viewed in the scanning electron microscope. (F) Magnified view of pith cells in the scanning electron microscope showing fungal sporulation inside pith cells, likely of Penicillium sp. (arrow).

