Abstract
Purpose
The purpose of this study is to analyze the utility of Convolutional Neural Network (CNN) in medical image analysis. In this study, deep learning (DL) models were used to classify the X-ray into COVID, viral pneumonia, and normal categories.
Materials and Methods
In this study, we have compared the results 9 layers CNN model (9 LC) developed by us with 2 transfer learning models (Visual Geometry Group) 16 and VGG19. Two different datasets used in this study were obtained from the Kaggle database and the Radiodiagnosis department of our institution.
Results
In our study, VGG16 yields the highest accuracy among all three models for different datasets as the Kaggle dataset-94.96% and the department of Radiodiagnosis dataset 85.71%. Although, the precision was found better while using 9 LC and VGG19 for both datasets.
Conclusions
DL can help the radiologists in the speedy prediction of diseases and detecting minor features of the disease which may be missed by the human eye. In the present study, we have used three models, i.e.,, CNN with 9 LCs, VGG16, and VGG19 transfer learning models for the classification of X-ray images with good accuracy and precision. DL may play a key role in analyzing the medical image dataset.
Keywords: Convolutional neural networks, COVID, deep learning, transfer learning, X-rays
INTRODUCTION
The ongoing COVID-19 pandemic had adversely impacted global health.[1] It was first reported in December 2019 in Wuhan, China, and was declared as a pandemic by the World Health Organization in January 2020.[2] The disease is caused by a new member of the severe acute respiratory syndrome coronavirus family (SARS-CoV) and designated as SARS-CoV-2.[3] Various techniques have been employed worldwide for the detection of COVID-19. Real-time polymerase chain reaction, Truenat screening, cartridge-based nucleic acid amplification test, rapid antibody, and rapid antigen test techniques are currently used for detection for COVID-19 in India.[4]
Medical imaging techniques such as computed tomography (CT) and X-rays play a vital role in the early diagnosis and treatment of COVID-19. COVID-19 causes abnormalities that are visible in the chest X-rays and CT images in the form of ground-glass opacities.[5] Diagnosis with radiological images could be the first step in monitoring COVID-19.[6] At present, the expansion of big data analytics is playing a vital role in the evolution of healthcare research and has generated enormous data from different resources. Artificial intelligence (AI) has offered a new ray of hope in helping physicians to predict more accurate and reproductive imaging diagnosis and thereby reducing their workload.
AI has gained huge momentum in recent times. The algorithms in AI work by finding the patterns in the dataset obtained from the diagnostic tests, which may be used to predict the clinical outcomes for unknown data. AI is based on the principle of the simulation of human intelligence in a way that a machine easily mimics it and executes the tasks, from simpler to complex ones. The goals of AI include learning, reasoning, and perception. Machine learning (ML), which is a subset of AI, has sparked over the past few years. Deep learning (DL) is part of a broader family of ML-based on the artificial neural network (ANN).[7] ANNs are computational processing systems, comprising interconnected nodes (artificial neurons) that work similarly to the biological neural network.[8] DL has a different architecture of convolutional neural networks (CNN) and recurrent neural networks, which have been applied to various fields such as bioinformatics,[9] natural language processing,[10] and medical imaging.[11]
In radiology, DL plays an important role in detecting diseases and thereby reducing human efforts. In DL, CNN or ConvNet is a class of deep neural networks, most commonly applied for the analysis of visual imagery. DL techniques have been successfully applied in various problems such as arrhythmia detection,[12,13,14] skin cancer classification,[15,16] breast cancer detection,[17,18] brain disease classification,[19] pneumonia detection from chest X-ray images,[20] fundus image segmentation,[21] and lung segmentation.[22,23]
In the present study, three DL models have been used for the automatic detection of COVID-19. These models are CNN with 9 convolutional layers (9 LC), Visual Geometry Group (VGG) 16, and VGG19.
MATERIALS AND METHODS
Dataset
CNN architecture is similar to the connectivity pattern of neurons in the human body with learnable weight and bias, designed to automatically and adaptively learn the spatial hierarchies of features. CNN models require input data to get trained and perform the predictions for unknown data. Input data used for this study was obtained from an open-source Kaggle database.[24,25,26] The dataset contained three types of chest X-ray images, i.e., COVID, normal and viral pneumonia X-ray images. The entire dataset consisted of a total of 3829 images with 1143 COVID pneumonia X-rays, 1341 normal X-rays, and 1345 viral pneumonia X-rays.
All images in the study were present in the portable network graphics file format with a resolution of 1024 × 1024 and 256 × 256 pixels. These images could be easily converted to 224 × 224 or 227 × 227 pixels, typically required by the popular CNNs. 1143 images were used from each class, i.e., COVID, normal and viral pneumonia, which were further classified into training dataset, validation dataset, and test dataset. The training dataset consisted of 2400 images, a validation dataset of 513 images and the test dataset consisted of 516 images out of 3429 images. Further, we have used the medical X-ray imaging data as the test dataset from the Department of Radiodiagnosis which consisted of 28 images of different patients. Out of 28 images, there were 17 COVID positive X-ray images, 11 normal X-ray images, and 0 viral pneumonia images.
Models and preprocessing the data
In this study, the experimental evaluations of three CNN models (9 LC, VGG16, VGG19) were performed using the Google Colab. Different CNN models have different input requirements. Transfer learning models (VGG16, VGG19) used in the study required a default input image pixel size of 224 × 224, while CNN with 9 LCs accepted the user-defined image size. All images used in the study were of 1024 × 1024 and 256 × 256-pixel size and were resized to 224 × 224 pixels. Further, during the preprocessing of each image, augmentation was used for improving the performance and accuracy of model data due to the limited data availability. Data augmentation[27] is a technique, which is used to increase the amount of data by modifying already existing data or newly created synthetic data from the existing data, which enhances the performance and ability of the model. The data augmentation techniques used in this study are rescaling (1/255), shear range (0.2), zoom range (0.2), rotation, (20°) horizontal flip, and vertical flip, typically applied for the training dataset to provide more useful information to the model. For the validation dataset and test dataset, only the rescaling (1/255) technique was applied.
Convolutional neural networks model with 9 LCs
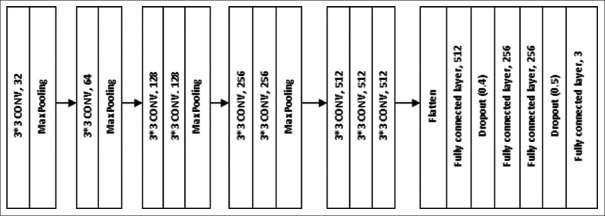
In this CNN model, 9 convolution layers with pooling layers were used. Each convolution layer consisted of different numbers of filters. The filter simply refers to the learned weights of the convolutions. In CNN, the filters detected spatial patterns such as edges in an image by detecting the changes in intensity values. Multiple filters are taken to slice through the image and map them one by one and learn different features of an input image. The architecture of the model is given in Figure 1.
Figure 1.
Convolutional neural network with 9LCs
The first convolutional layer consisted of 32 filters of size 3 × 3, ReLu as an activation function, same padding, and default stride of (1, 1). The convolutional layer is followed by a pooling function, i.e., MaxPooling two-dimensional (2D), which adds a 2D max pooling layer with pooling filter size 2 × 2, a stride of (2, 2), and the same padding. The second layer consisted of 64 filters of size 3 × 3, same padding, ReLu as an activation function, default stride (1, 1), and this layer was followed by the MaxPooling layer with filter size 2 × 2 and stride of (2, 2). The third and fourth layers consisted of the same parameters, i.e., 128 filters of size 3 × 3, same padding, ReLu as an activation function, and default stride of (1, 1). These two layers were followed by a single MaxPooling layer with filter size 2 × 2, a stride of (2, 2), and same padding. Each of the fifth and sixth layers consisted of 256 filters of size 3 × 3, same padding, ReLu as an activation function, and default stride of (1, 1). These two layers were followed by a single MaxPooling layer with filter size 2 × 2 and stride of (2, 2) and same padding. Similarly, the seventh, eighth, and ninth layers consisted of 512 filters of size 3 × 3, same padding, ReLu as an activation function, and default stride of (1, 1). These three layers were followed by a single MaxPooling layer with filter size 2 × 2 and stride of (2, 2) and same padding. After feature sampling and downsampling by convolutional layer and pooling layer, respectively, the output feature map of the convolution layers was transformed into a 1-D array of numbers (7 × 7 × 512) using the flattening layer and connected to fully connected layers or dense layers. The last fully-connected layer had the same number of output nodes as the number of classes for the classification problem. Every fully connected layer was followed by an activation function. The last layer had different activation functions compared to the other layers.
In this study, four dense layers were used. The first dense layer consisted of 512 units and ReLu as an activation function. The units used in the first layer had the dimension of outer space, which implied the shape of the tensor that is produced by the layer, and that will in turn be the input for the next layer. This layer was followed by a dropout layer with a rate equal to 0.4. The dropout layer is used to avoid overfitting. The rate parameter in the dropout layer, which is a float number between 0 and 1, decides the fraction of the input units to be dropped. The second and third dense layers were the same. Both units had 256 units and ReLu as an activation function. These two layers were followed by a single dropout layer with a rate equal to 0.4. The fourth layer consisted of softmax as an activation function and 3 units, which were required for the classification of images into three categories.
After defining the sequence of layers, the entire layer model was compiled. In this step, we specified the loss function, an optimizer, and metrics as categorical cross-entropy, Adam with learning rate equal to 0.0001 and accuracy, respectively. The compilation was the last step in building a model. After building, the model was trained with training images and the validation dataset was used for validation. A batch of 64 images of the training dataset and validation was given to the model during the training process. After training of the model, the classification of test images and images collected from the Department of Radiodiagnosis as test data were predicted with the help of the trained model.
VGG16 transfer learning model
Transfer learning in ML is simply making use of a model, which is trained on large datasets and leveraging the extract information on a new and similar problem. The architecture of VGG-16 is shown in Figure 2. It used 13 convolutional layers and 3 fully connected layers. All convolutional layers in VGG-16 were 3 × 3 convolutional layers with a stride size of (1, 1) and the same padding, and every pooling layer was 2 × 2 pooling layer with a stride size of (2, 2). The default input image size required for VGG-16 is 224 × 224 pixels with three channels. After each pooling layer, the size of the feature map was reduced by half. The last feature map, before the fully connected layers, was 7 × 7 with 512 channels and it was expanded into a vector with 25,088 (7 × 7 × 512) channels. To make use of the VGG16 model in our problem, the final fully-connected layers were removed as they were intended for 1000 class problems in ImageNet and a flatten layer, 4 final dense layers with 512,128,128 and 3 units, respectively, were added to classify the given images into three categories. The first dense layer with 512 units and the ReLu activation function was followed by a dropout layer with a rate of 0.4. The next two layers with the same number of 256 units and the ReLu activation function were followed by another dropout layer with a rate of 0.5. The final layer had 3 units and softmax as an activation function to classify the images into three categories. The model was compiled with categorical cross-entropy loss function, optimizer as Adam with learning rate equal to 0.0001, and metrics as accuracy. The model was trained with the training image set and validated the model using the validation data, which provided information for adjusting the hyperparameters. After training, the test dataset images and the images collected from the Department of Radiodiagnosis were classified using the trained model.
Figure 2.
VGG16 model
VGG19 transfer learning model
The architecture of VGG-19 is shown in Figure 3. It used 16 convolutional layers and 3 fully connected layers. All convolutional layers in VGG-19 were 3 × 3 convolutional layers with a stride size of (1, 1) and the same padding, and the pooling layers were 2 × 2 pooling layers with a stride size of (2, 2). The default input image size required for VGG-19 was 224 × 224 with three channels. After each pooling layer, the size of the feature map was reduced by half. The last feature map before the fully connected layers was 7 × 7 with 512 channels and it was expanded into a vector with 25,088 (7 × 7 × 512) channels. To make use of the VGG19 model in our problem, the final fully-connected layers were removed and 4 dense layers with 512, 256, 256, and 3 units, respectively, were used to classify the given images into three categories using the softmax activation function
Figure 3.
VGG19 model
The first dense layer with 512 units and the ReLu activation function was followed by a dropout layer with a rate of 0.4. The next two layers with the same number of 256 units and the ReLu activation function were followed by another dropout layer with a rate of 0.5. The final layer had 3 units and softmax as an activation function to classify the images into three categories. The model was compiled with categorical cross-entropy loss function, optimizer as Adam with learning rate equal to 0.0001, and metrics as accuracy. The model was trained with training image set and validated the model using the validation data. After training, the test dataset images and images collected from the Department of Radiodiagnosis were classified using trained model.
Training of the models
Figure 4 depicts workflow diagram for the classification of images using all the 3 models. With the training dataset, all three models were trained. During training, the validation data helped in reducing the overfitting of models. For training the models, the batch size was 64 images for training data and validation data. CNN model with 9 LCs, VGG16, and VGG19 models was trained with 40 epochs. The loss and accuracy values are stored in arrays, which were plotted using a Python plotting library Matplotlib[28] for all the models.
Figure 4.
Workflow diagram for classification using of images Convolutional Neural Network models
Performance evaluation matrix
The performance of the trained model was evaluated using the confusion matrix for the classification of X-ray images into different categories. With the help of a confusion matrix shown in Figure 5, the model was evaluated using accuracy, precision, recall, and F1 score.
Figure 5.

Confusion matrix
Using confusion matrix accuracy, precision, recall, and F1 score can be calculated as follows:


RESULTS AND DISCUSSION
CNN classified the images by extracting the features from images. This made CNN classify the images with very minute and subtle changes. In this study, the performance of three CNN models (CNN with 9 LCs, VGG16, VGG19) for the classification of COVID-19, normal and viral pneumonia X-ray images were studied. Out of the total data used from the Kaggle database, 70% of the data were reserved for training, 15% for validation while the rest 15% data was reserved for the test data.
For all three models, the training accuracy (accuracy) validation accuracy, training loss (loss), and validation loss were interpreted by Figures 6-8, respectively.
Figure 6.
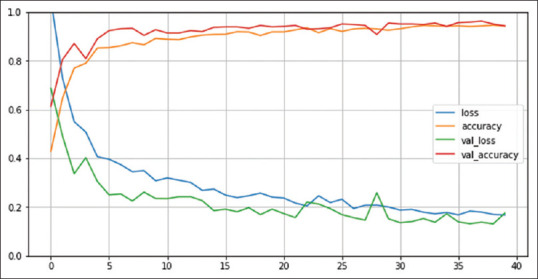
Number of epochs. Convolutional Neural Network with 9LC
Figure 8.
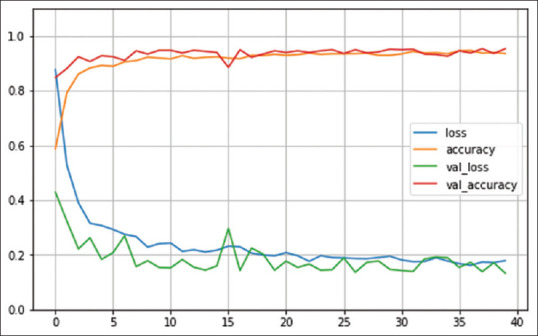
Number of epochs. VGG19 model
Figure 7.
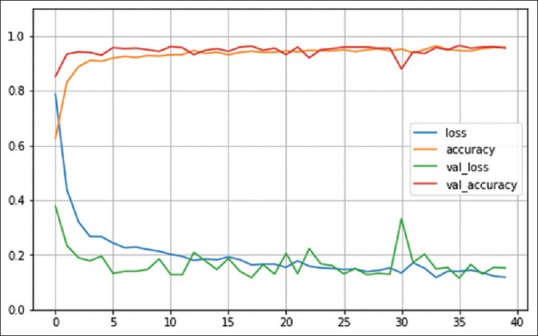
Number of epochs. VGG16 model
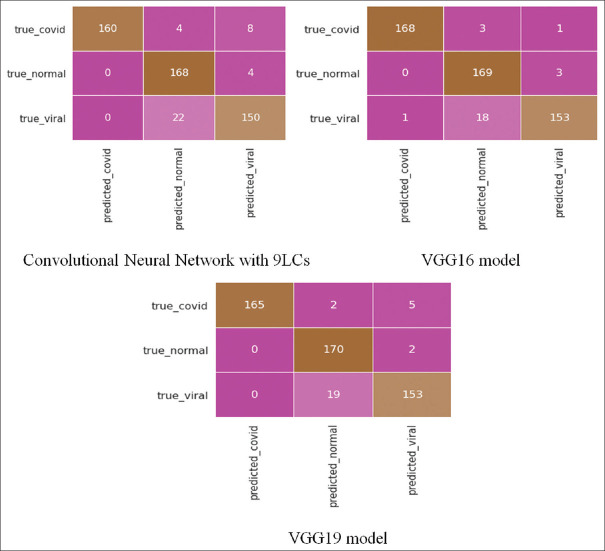
For the Kaggle test dataset, confusion matrices of all three models are depicted in Figure 9.
Figure 9.
Confusion matrices for all the three models for the Kaggle test dataset
CNN model with 9 LCs detected 160 correct COVID pneumonia cases out of 172 cases, 168 correct normal cases out of 172 cases and 150 correct viral pneumonia cases out of 172 cases. VGG16 model detected 168 correct COVID pneumonia cases out of 172 cases, 169 correct normal cases out of 172 cases, and 153 correct viral pneumonia cases out of 172 cases. VGG19 model detected 165 correct COVID pneumonia cases out of 172 cases, 170 correct normal cases out of 32 cases, and 153 correct viral pneumonia cases out of 172 cases.
The performance of three models for the Kaggle test dataset used in this study is given in Table 1, which shows that the VGG16 model gave the best results on the Kaggle database test dataset. It showed an accuracy of 94.96%, a precision of 99.40%, and F1 score equal to 98.52%.
Table 1.
Performance of the models for the Kaggle test dataset
| Model | Accuracy, % | Precision, % | F1 score, % |
|---|---|---|---|
| CNN with 9 convolutional layers | 92.64 | 100 | 96.38 |
| VGG16 | 94.96 | 99.40 | 98.52 |
| VGG19 | 94.57 | 100 | 97.92 |
CNN: Convolutional neural network
Sahinbas and Catak used five different pretrained models i.e., VGG16, VGG19, ResNet, Densenet, and Inception V3 for the classification of X-rays into two categories.[29] In that study, VGG16 provided the highest accuracy of 80%. Mohammadi et al. have also classified chest X-Ray into two categories using four transfer learning models, in a result VGG16 provided an accuracy of 93.6 as compared to 90.8% provided by VGG19.[30]
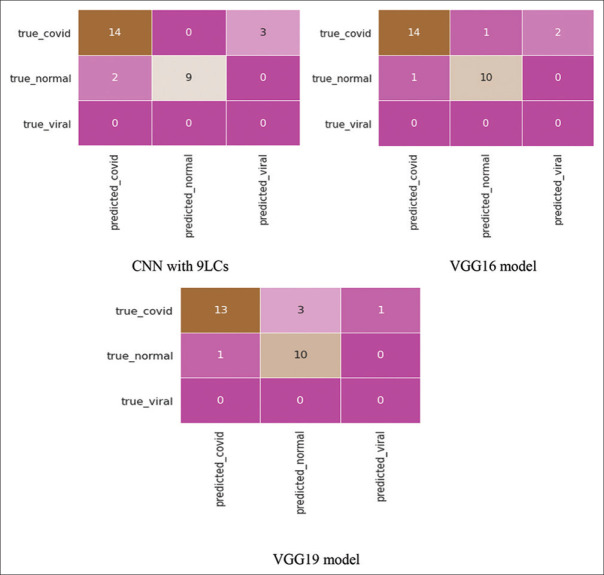
While for the data of the Department of Radiodiagnosis, the confusion matrices for all three models are given in figure 10.
Figure 10.
Confusion matrices for all the three models for the Department of Radiodiagnosis test dataset
For the Department of Radiodiagnosis test data, the CNN model with 9 LCs detected 14 correct COVID pneumonia cases out of 17 cases and 9 correct normal cases out of 11 cases. VGG16 model detected 14 correct COVID pneumonia cases out of 17 cases and 10 correct normal cases out of 11 cases. VGG19 model detected 13 correct COVID pneumonia cases out of 17 cases and 10 correct normal cases out of 11 cases.
For the Department of Radiodiagnosis test dataset, the performance of the three models used in this study is given in Table 2.
Table 2.
Performance of the models for the Department of Radiodiagnosis test dataset
| Model | Accuracy, % | Precision, % | F1 score, % |
|---|---|---|---|
| CNN with 9LCs | 82.14 | 87.50 | 84.85 |
| VGG16 | 85.71 | 93.33 | 87.50 |
| VGG19 | 82.14 | 92.86 | 83.87 |
CNN: Convolutional neural network
From table 2, we concluded that the VGG16 model gave the best results with the Department of Radiodiagnosis test dataset. It showed an accuracy of 85.71%, a precision of 93.33%, and F1 score equal to 87.50%.
In this study, we have used 3 different CNN models, the CNN model with 9 LCs, VGG16, and VGG19 for the classification of COVID, normal and viral pneumonia images. On comparing the performance of these models, VGG16 yields the highest accuracy among all three models for different datasets (Kaggle dataset-94.96%, Department of Radiodiagnosis data – 85.71%).
CONCLUSIONS
In this present study, the CNN with 9 LCs provided results as compared to well-established VGG16 and VGG19 models. The study had revealed a higher accuracy, precision, and F1 score achieved in the Kaggle X-ray images in comparison to the X-ray images of the Department of Radiodiagnosis. The reason may be due to the differences in the image quality of the two datasets. The data from the Department of Radiodiagnosis were collected with a portable 100 KV X-ray machine. The conditions under which the X-ray images were taken would have contributed to the compromise in image quality, as most of the X-ray images were taken at the bedside.
The detection of COVID-19 at the early stages is very important for limiting the spread of the disease. X-ray imaging is the most common and cheap imaging tool used in practice for the diagnosis of various diseases including COVID-19. It requires deep knowledge and experience for the detection of diseases using X-rays. DL may play an important role in the detection of disease, which may further reduce the workload of clinicians.
DL can uncover the hidden patterns, abnormalities based on extracted features from unstructured big data. Thus, we may conclude that DL has the potential to play an important role in the early detection of COVID-19 with good accuracy. It may help in reducing the cost and time in the detection of COVID-19 disease, along with reducing the immense workload on clinicians in a pandemic scenario like COVID-19. DL may play a key role in analyzing the image dataset in other healthcare subfields as radiotherapy treatment simulation, treatment planning, quality assurance, and histopathology image analysis.
Financial support and sponsorship
Nil.
Conflicts of interest
There are no conflicts of interest.
REFERENCES
- 1.Coronavirus Disease (COVID-19) – World Health Organization. [Last accessed on 2021 Feb 05]. Available from: https://www.who.int/emergencies/diseases/novel-coronavirus-2019 .
- 2.Coronavirus (COVID-19) Events as they Happen. [Last accessed on 2021 Feb 05]. Available from: https://www.who.int/emergencies/diseases/novel-coronavirus-2019/events-as-they-happen .
- 3.Lai CC, Shih TP, Ko WC, Tang HJ, Hsueh PR. Severe acute respiratory syndrome coronavirus 2 (SARS-CoV-2) and coronavirus disease-2019 (COVID-19): The epidemic and the challenges. International Journal of Antimicrobial Agents. 2020;55:105924. doi: 10.1016/j.ijantimicag.2020.105924. [DOI] [PMC free article] [PubMed] [Google Scholar]
- 4.Kumar KSR, Mufti SS, Sarathy V, Hazarika D, Naik R. An Update on Advances in COVID-19 Laboratory Diagnosis and Testing Guidelines in India. Front Public Health. 2021;9:568603. doi: 10.3389/fpubh.2021.568603. doi: 10.3389/fpubh.2021.568603. PMID: 33748054. PMCID: PMC7969786. [DOI] [PMC free article] [PubMed] [Google Scholar]
- 5.Song F, Shi N, Shan F, Zhang Z, Shen J, Lu H, et al. Emerging 2019 novel coronavirus (2019-nCoV) pneumonia. Radiology. 2020;295:210–7. doi: 10.1148/radiol.2020200274. [DOI] [PMC free article] [PubMed] [Google Scholar]
- 6.Li Y, Xia L. Coronavirus disease 2019 (COVID-19): Role of chest CT in diagnosis and management. Am J Roentgenol. 2020;214:1280–6. doi: 10.2214/AJR.20.22954. [DOI] [PubMed] [Google Scholar]
- 7.Deep Learning. Wikipedia. 2021. [Last accessed on 2021 Feb 08]. Available from: https://en.wikipedia.org/w/index.php?title=Deep_learning&oldid=1004602268 .
- 8.O'Shea K, Nash R. An Introduction to Convolutional Neural Networks. arXiv. [Last accessed on 2021 Feb 08]. 151108458; 2015 Dec 2. Available from: http://arxiv.org/abs/1511.08458 .
- 9.Li Y, Huang C, Ding L, Li Z, Pan Y, Gao X. Deep learning in bioinformatics: Introduction, application, and perspective in the big data era. Methods. 2019;166:4–21. doi: 10.1016/j.ymeth.2019.04.008. [DOI] [PubMed] [Google Scholar]
- 10.Yang H, Luo L, Chueng LP, Ling D, Chin F. Deep learning and its applications to natural language processing. In: Huang K, Hussain A, Wang QF, Zhang R, editors. Deep Learning: Fundamentals, Theory and Applications. Cham: Springer International Publishing; 2019. [Last accessed on 2021 Feb 08]. pp. 89–109. Cognitive Computation Trends. Available from: https://doi.org/10.1007/978-3-030-06073-2_4 . [Google Scholar]
- 11.Kim M, Yun J, Cho Y, Shin K, Jang R, Bae HJ, et al. Deep learning in medical imaging. Neurospine. 2019;16:657–68. doi: 10.14245/ns.1938396.198. [DOI] [PMC free article] [PubMed] [Google Scholar]
- 12.Yıldırım Ö, Pławiak P, Tan RS, Acharya UR. Arrhythmia detection using deep convolutional neural network with long duration ECG signals. Comput Biol Med. 2018;102:411–20. doi: 10.1016/j.compbiomed.2018.09.009. [DOI] [PubMed] [Google Scholar]
- 13.Hannun AY, Rajpurkar P, Haghpanahi M, Tison GH, Bourn C, Turakhia MP, et al. Cardiologist-level arrhythmia detection and classification in ambulatory electrocardiograms using a deep neural network. Nat Med. 2019;25:65–9. doi: 10.1038/s41591-018-0268-3. [DOI] [PMC free article] [PubMed] [Google Scholar]
- 14.Acharya UR, Oh SL, Hagiwara Y, Tan JH, Adam M, Gertych A, et al. A deep convolutional neural network model to classify heartbeats. Comput Biol Med. 2017;89:389–96. doi: 10.1016/j.compbiomed.2017.08.022. [DOI] [PubMed] [Google Scholar]
- 15.Esteva A, Kuprel B, Novoa RA, Ko J, Swetter SM, Blau HM, et al. Dermatologist-level classification of skin cancer with deep neural networks. Nature. 2017;542:115–8. doi: 10.1038/nature21056. [DOI] [PMC free article] [PubMed] [Google Scholar]
- 16.Codella NCF, Nguyen Q-B, Pankanti S, Gutman DA, Helba B, Halpern AC, et al. Deep learning ensembles for melanoma recognition in dermoscopy images. IBM Journal of Research and Development. 2017 Jul;61(4/5):5:1–5:15. [Google Scholar]
- 17.Celik Y, Talo M, Yildirim O, Karabatak M, Acharya UR. Automated invasive ductal carcinoma detection based using deep transfer learning with whole-slide images. Pattern Recognit Lett. 2020;133:232–9. [Google Scholar]
- 18.Cruz-Roa A, Basavanhally A, González F, Gilmore H, Feldman M, Ganesan S, et al. Automatic detection of invasive ductal carcinoma in whole slide images with Convolutional Neural Networks. Progress in Biomedical Optics and Imaging - Proceedings of SPIE. 2014;28:9041. [Google Scholar]
- 19.Talo M, Yildirim O, Baloglu UB, Aydin G, Acharya UR. Convolutional neural networks for multi-class brain disease detection using MRI images. Computerized Medical Imaging and Graphics. 2019;78:101673. doi: 10.1016/j.compmedimag.2019.101673. [DOI] [PubMed] [Google Scholar]
- 20.Rajpurkar P, Irvin J, Zhu K, Yang B, Mehta H, Duan T, et al. CheXNet: Radiologist-Level Pneumonia Detection on Chest X-Rays with Deep Learning. arXiv. [Last accessed on 2021 Feb 08]. 171105225; 2017 Dec 25. Available from: http://arxiv.org/abs/1711.05225 .
- 21.Tan JH, Fujita H, Sivaprasad S, Bhandary SV, Rao AK, Chua KC, et al. Automated segmentation of exudates, haemorrhages, microaneurysms using single convolutional neural network. Inform Sci. 2017;420:66–76. [Google Scholar]
- 22.Gaál G, Maga B, Lukács A. Attention U-Net Based Adversarial Architectures for Chest X-ray Lung Segmentation. arXiv. [Last accessed on 2021 Feb 08]. 200310304; 2020 Mar 23. Available from: http://arxiv.org/abs/2003.10304 .
- 23.Souza JC, Bandeira Diniz JO, Ferreira JL, França da Silva GL, Corrêa Silva A, de Paiva AC. An automatic method for lung segmentation and reconstruction in chest X-ray using deep neural networks. Comput Methods Programs Biomed. 2019;177:285–96. doi: 10.1016/j.cmpb.2019.06.005. [DOI] [PubMed] [Google Scholar]
- 24.COVID-19 Radiography Database. (n.d.) [Last accessed on 2020 Dec 10]. Available from: https://kaggle.com/tawsifurrahman/covid19-radiography-database .
- 25.Can AI Help in Screening Viral and COVID-19 Pneumonia? [Last accessed on 2021 May 10]. Available from: https://ieeexplore.ieee.org/document/9144185 .
- 26.Rahman T, Khandakar A, Qiblawey Y, Tahir A, Kiranyaz S, Abul Kashem SB, et al. Exploring the effect of image enhancement techniques on COVID-19 detection using chest X-ray images. Computers in Biology and Medicine. 2021 May;1:132–104319. doi: 10.1016/j.compbiomed.2021.104319. [DOI] [PMC free article] [PubMed] [Google Scholar]
- 27.Data augmentation | TensorFlow Core. (n.d.) TensorFlow. [Last accessed on 2020 Dec 10]. Available from: https://www.tensorflow.org/tutorials/images/data_augmentation .
- 28.Matplotlib: Python Plotting – Matplotlib 3.3.3 Documentation. (n.d.) [Last accessed on 2020 Dec 10]. Available from: https://matplotlib.org/
- 29.Sahinbas K, Catak FO. 24 - Transfer learning-based convolutional neural network for COVID-19 detection with X-ray images. In: Kose U, Gupta D, de Albuquerque VHC, Khanna A, editors. Data Science for COVID-19 [Internet] Academic Press; 2021. [Last accessed on 2021 May 29]. pp. 451–66. cited 2021 May 29. Available from: https://www.sciencedirect.com/science/article/pii/B9780128245361000034 . [Google Scholar]
- 30.Mohammadi R, Salehi M, Ghaffari H, Rohani AA, Reiazi R. Transfer learning-based automatic detection of coronavirus disease 2019 (COVID-19) from chest X-ray images. J Biomed Phys Eng. 2020;10:559–68. doi: 10.31661/jbpe.v0i0.2008-1153. [DOI] [PMC free article] [PubMed] [Google Scholar]


