Figure 5.

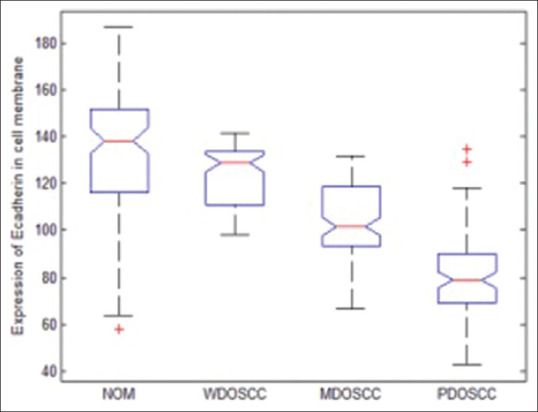
The Whisker's notched box plot representation of the distribution of membranous gray scale intensity of epithelia-cadherin in normal oral mucosa and different grades of oral squamous cell carcinoma

The Whisker's notched box plot representation of the distribution of membranous gray scale intensity of epithelia-cadherin in normal oral mucosa and different grades of oral squamous cell carcinoma