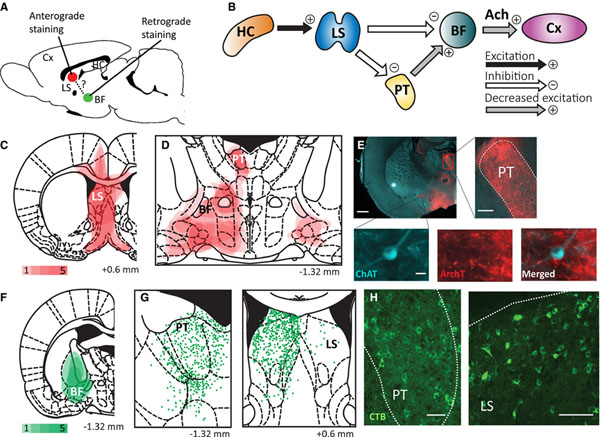
FIGURE 1.
Immunofluorescent histology from anterograde and retrograde tracing suggests a direct anatomical pathway from lateral septum to basal forebrain and an indirect pathway via the paratenial nucleus of the thalamus. A, Schematic showing anterograde tracer targeting the lateral septum (LS) and retrograde tracer targeting the basal forebrain (BF). Cx, cortex. B, Schematic circuit diagram suggested by our tracing and electrophysiology experimental results. A limbic seizure originating in the hippocampus (HC) activates LS, which can either directly inhibit BF or indirectly do so by reducing excitatory output from the thalamic paratenial nucleus (PT). Both pathways result in decreased acetylcholine (Ach) arousal to the Cx. C, Summary showing the sites of anterograde tracer injections in LS. D, Summary showing areas (red) where axon fibers were found. Projections were seen in PT and various areas of the BF (see text for details). Red density color bar key for C and D indicates the number of animals (1–5) for which staining was found in each region. E, Example of anterograde projections in a choline acetyltransferase (ChAT)-Cre rat coronal section at approximately anteroposterior (AP) −1.32 mm. Insets show dense fibers in PT, as well as fibers interfacing with a ChAT-positive neuron in BF. White scale bar indicates 1 mm in large section, 0.2 mm in the PT inset, and 20 μm in the ChAT inset. ArchT, archaerhodopsin. F, Sites of retrograde cholera toxin B (CTB) tracer injections targeting BF. Green density color bar key indicates the number of animals (1–5) for which staining was found in each region. G, Schematic showing cell bodies centered on PT and LS superimposed for all five animals. Each green point represents one neuron body. H, Histology examples showing retrograde CTB-stained neuronal cell bodies in PT (approximately AP, −1.32 mm) and LS (approximately AP, +0.6 mm). All projections and cell bodies were detected manually. White scale bars indicate 0.1 mm. Coronal section schematics are presented in AP coordinates relative to bregma from a rat atlas.11 Brain atlas sections in C, D, F, and G are reproduced with permission from G. Paxinos and C. Watson, The Rat Brain in Stereotaxic Coordinates, 6th Edition, Academic Press, 2007

