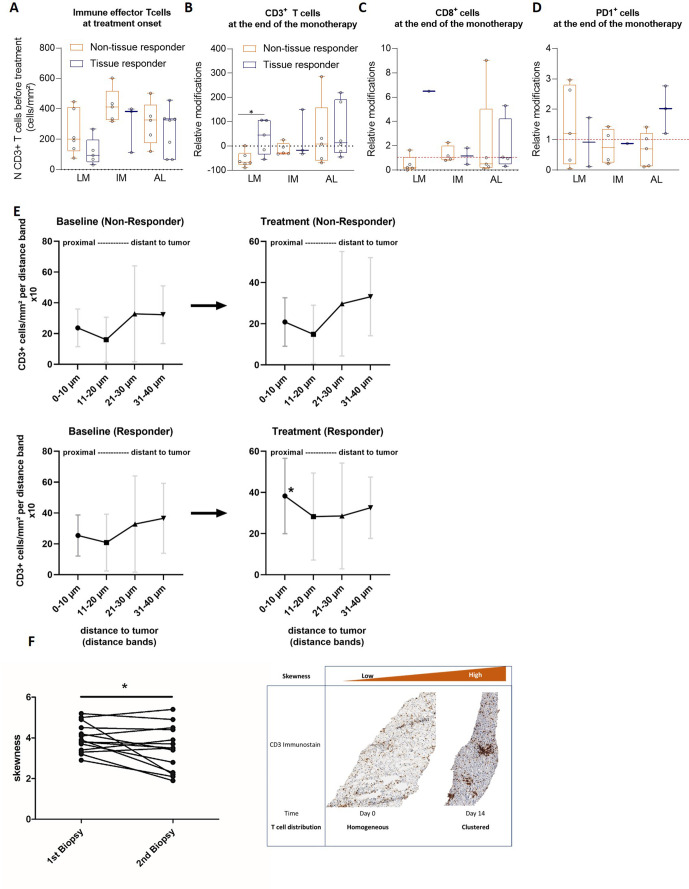
Figure 6.
Comparative immune landscape in tissues at the onset of treatment with NOX-A12 and impact of NOX-A12 in the immune landscape in responders and non-responders. (A) Density of effector T cells in liver metastases split in three regions (LM=liver metastasis, IM=invasive margin and AL=adjacent liver) in tissue responders and non-responders. (B–D) Relative changes in T cell density in the regions depicted in (A) in the corresponding patients, expressed as (density(d14) – density(d0)*100/density(d0)), for CD3 (B), CD8 (C) and PD1 stains (D). (E) Distribution/proximity analysis of T cells in the tissue biopsy collected at the onset (left) and at the end (right) of the NOX-A12 monotherapy, in tissue responders and non-responders. (F) Modification in the T cell skewness in all biopsies. CXCL12, chemokine (C-X-C motif) ligand 12.

