Figure 7.

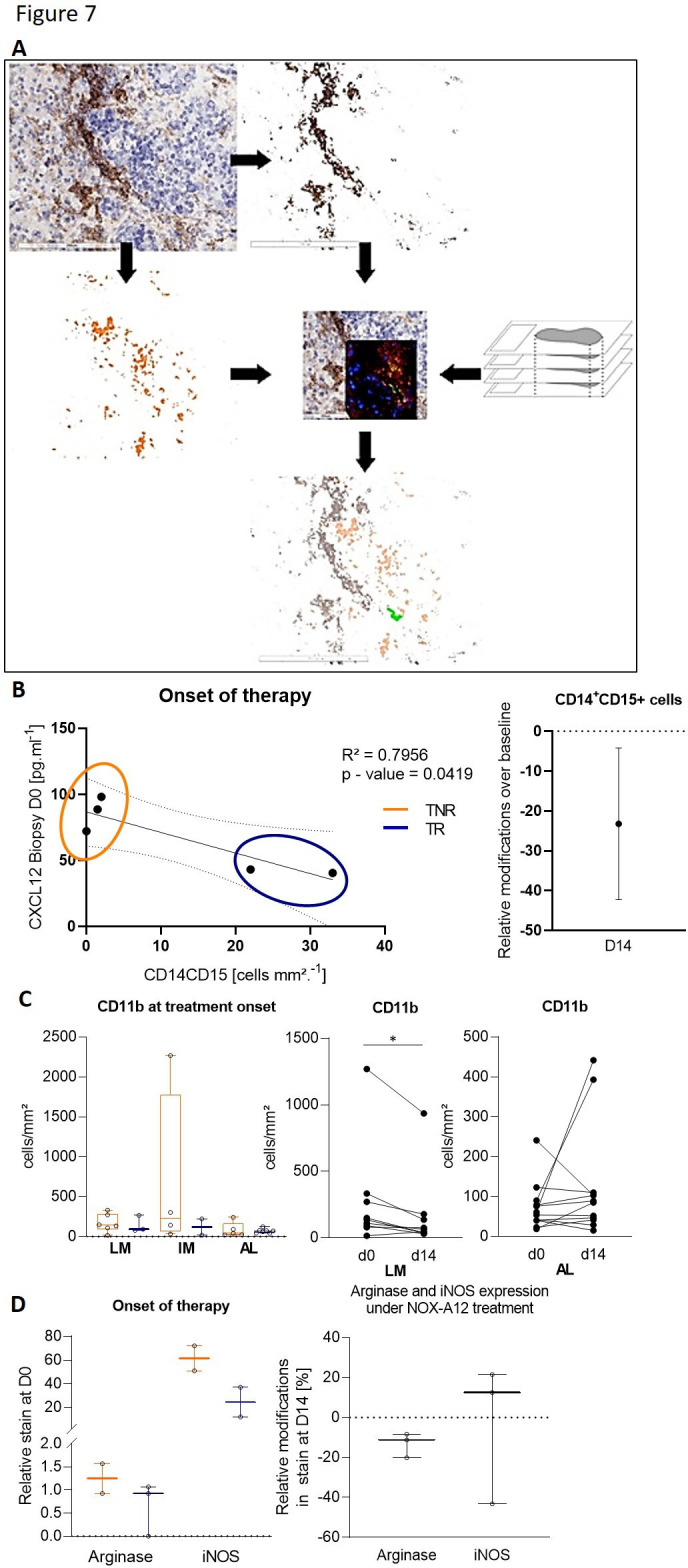
Identification of a CXCL12-associated CD14+ CD15 monocytic precursor cell type and myeloid markers associated with tissue response to NOX-A12 treatment. (A) Schematics of the virtual thin section overlay workflow applied to identify the CD14+CD15+CXCL12+ cells in tissue biopsies. Comparative immune landscape in tissues at the onset of treatment with NOX-A12 and impact of NOX-A12 in the immune landscape in responders and non-responders (left) and the relative changes in CD14+CD15+ cell density at day 14 (right). (B) Dot plot illustrating the concentration of CXCL12 in the liver metastasis at the onset of treatment, as well as its correlation with the density of CX14+CD15+ cells in the corresponding tissues at the same time point. (C) Density of CD11b+ cells at treatment onset and under treatment. (D) Density of cells positive for arginase and iNOS immunostains before the onset of therapy, in responders and non-responder (left) and relative changes under treatment (right).
