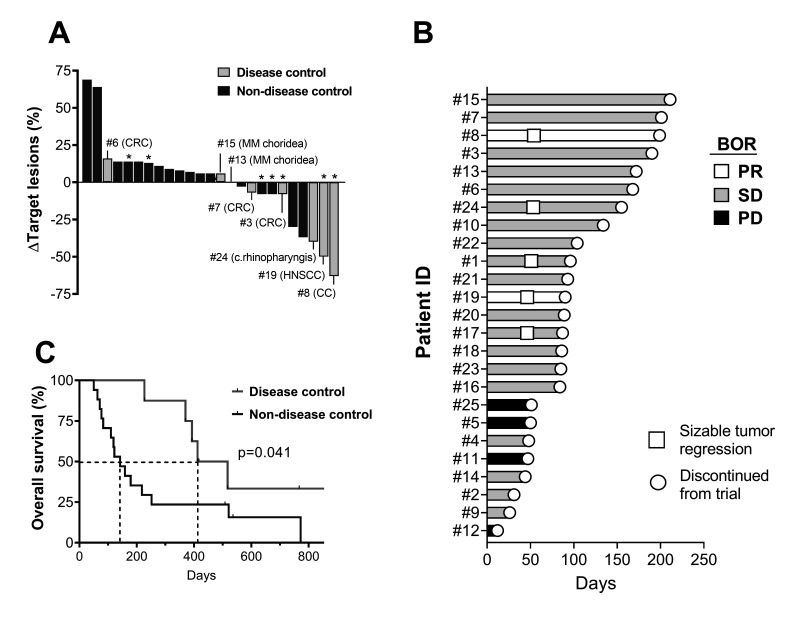
Figure 2.
Clinical efficacy and OS. (A) Best change in target lesion sum of all patients. The patients with disease control (PR and/or SD >4.5 months) are marked with light gray and listed with cancer diagnoses. (B) Swimmer’s plot showing the duration of response in the individual patients and indicating start of tumor regressions >30% of target lesions. (C) Kaplan-Meier plot of the OS in the benefit and non-benefit groups. The survival curves are compared with a log-rank test. *The patients with antitumor reactive cells in vitro. BOR, best overall response; CC, cholangiocarcinoma; CRC, colorectal cancer; HNSCC, head-and-neck squamous cell carcinoma; MM, malignant melanoma; OS, overall survival; PD, progressive disease; PR, partial response; SD, stable disease.

