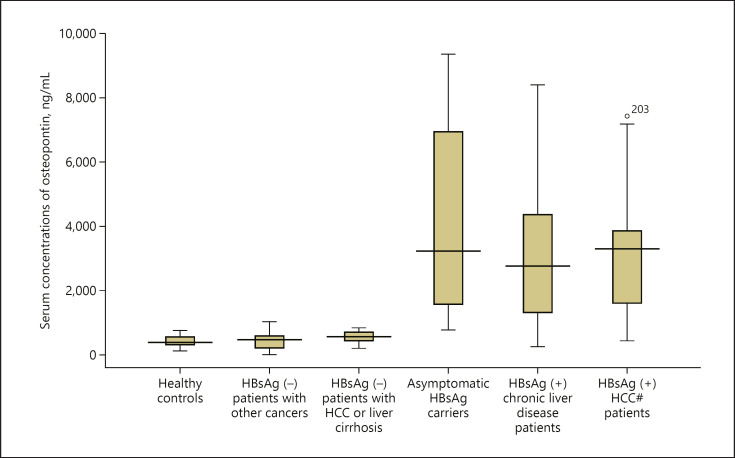
Fig. 1.
Comparative analysis of the serum concentrations of OPN. The box plot shows median values, upper and lower quartiles, and the largest and smallest observations. Concentrations of OPN of the healthy control group (n = 50) (a); Concentrations of OPN of the other tumors group (n = 39) (b); Concentrations of OPN of the HBsAg (−) patients with HCC or LC group (n = 12) (c); Concentrations of OPN of the asymptomatic HBsAg carrier group (n = 62) (d); Concentrations of the OPN of the chronic liver diseases group (n = 28) (e); Concentrations of the OPN of the HCC group (n = 50) (f). OPN, osteopontin; HCC, hepatocellular carcinoma; LC, liver cirrhosis.

