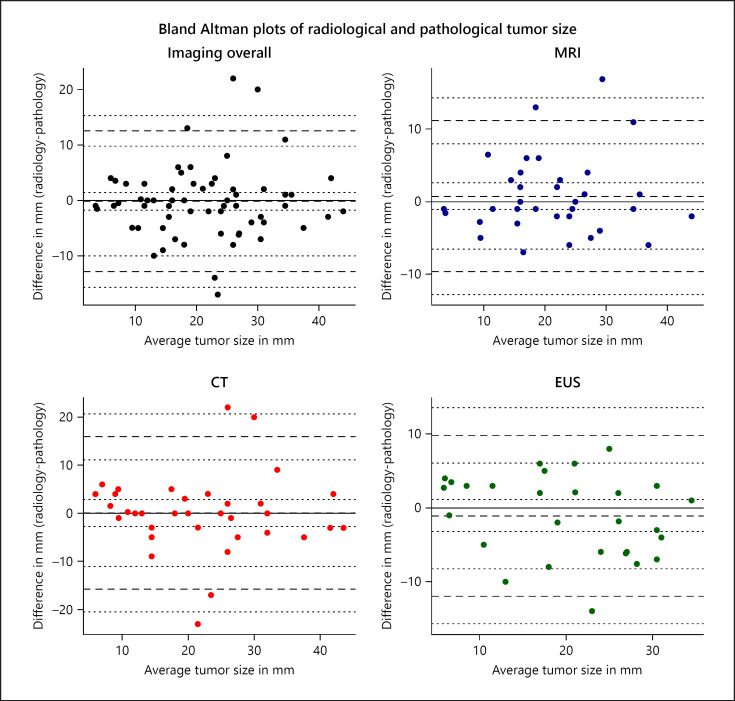
Fig. 3.
Bland-Altman plots of radiological and pathological tumor size of MEN1-related pNETs. For every patient, the difference between the radiological and pathological tumor size (y axis) is plotted against the mean of the 2 measurements (x axis). The mean and standard deviation (SD) of these differences are used to calculate the limits of agreement (LoA) (mean difference ±1.96 × SD). The LoA indicate the range of observer variation; differences beyond the LoA are not accounted for by observer variation alone [29]. The solid line shows a mean bias of 0. The middle dashed line represents the mean difference between radiological and pathological tumor size, with dotted lines indicating 95% confidence intervals (95% CI) of the mean bias. The upper and lower dashed lines represent the upper and lower LoA with subsequent upper and lower bounds of the 95% CI of the LoA shown in dotted lines. EUS, endoscopic ultrasonography.

