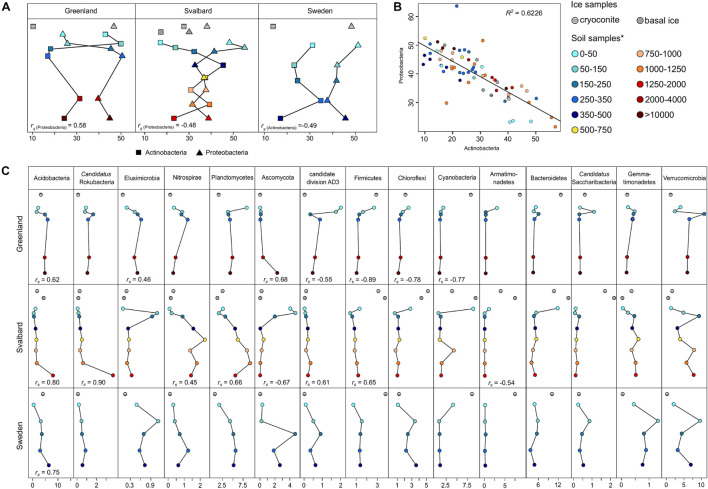
FIGURE 5.
Taxonomy classification at the phylum level. (A) Actinobacteria and Proteobacteria trends in the dataset. (B) Linear model relation between Actinobacteria and Proteobacteria relative abundances (p-value = 3 × 10– 15). (C) Remaining phylum trends in the datasets. Spearman’s rank correlation coefficient (rs) was calculated between the sample distance and the relative abundance data for each phylum. rs is reported below the appropriate line plot only when significant (p-value < 0.05). *Soil samples are categorized in relation to their distance from the ice edge (m).

