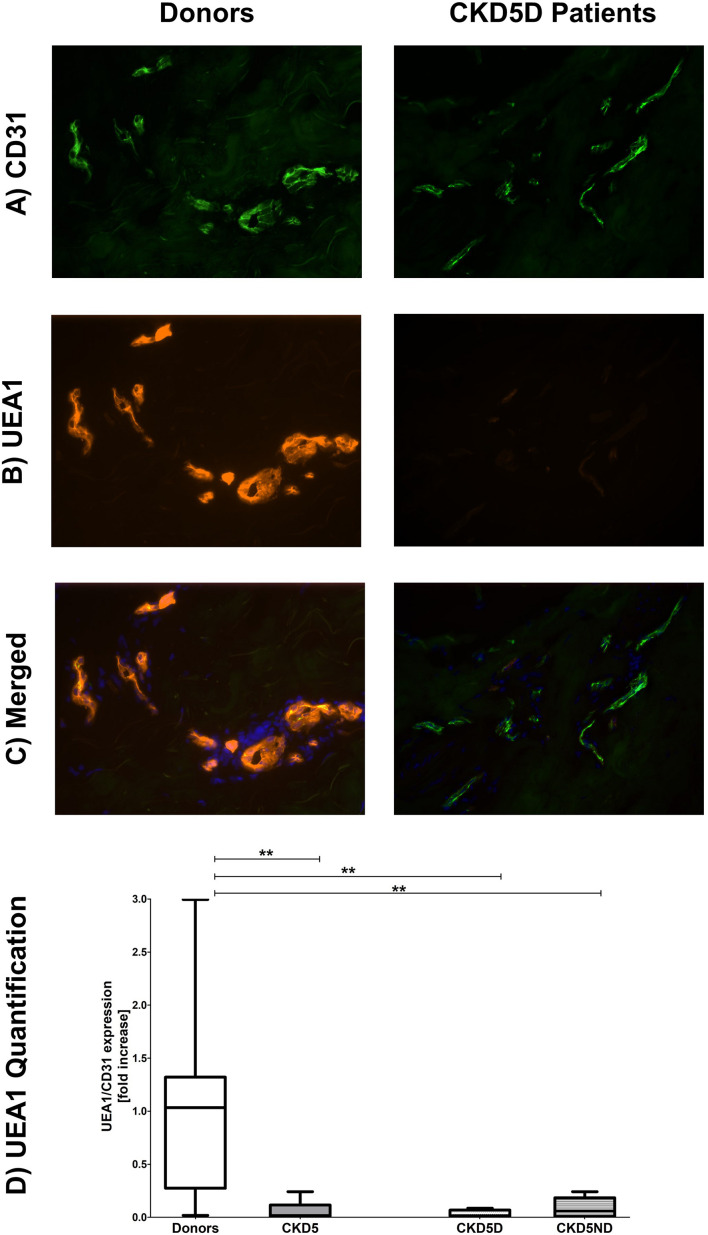
FIGURE 2.
Expression of UEA1 in the microvasculature of dermal biopsies patients with CKD. (A) Expression of CD31 in donors (left image) and CKD5D patients (right image). (B) Expression of UEA1 in donors (left image) and CKD5D patients (right image). (C) Merged expression of UEA1 and CD31 in donors (left image) and CKD5D patients (right image). (D) UEA1 quantification relative to CD31. Colors in images: green = CD31; red = UEA1; blue = DAPI. Statistical significance: **P < 0.01.

