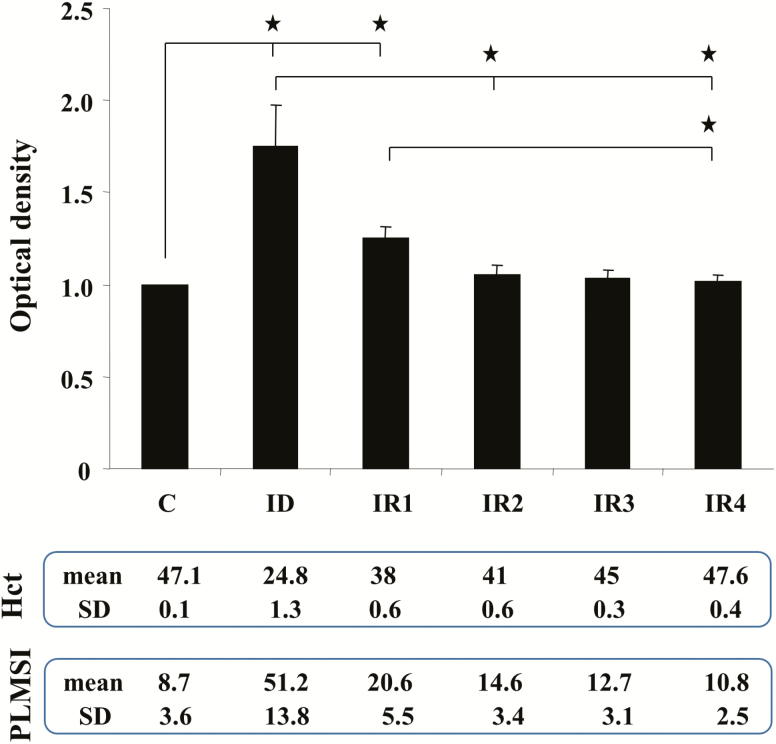
Figure 5.
Striatal histamine H3 receptor (H3R) levels in control (C), iron-deficient (ID) and iron-replacement (IR) week 1 (IR1), week 2 (IR2), week 3 (IR3), and week 4 (IR4) rats. Top panel: Relative density of bands expressed as the ratio of H3R and actin in each animal group (mean ± SEM). Middle panel: average (mean) and SD of hematocrit levels (Hct) taken from the rat performing western blot experiment. Lower panel: mean and SD of index of PLMS (PLMSI) taken from the rat performing western blot experiment. *p < 0.05, post hoc test. N = 4 each.

