Figure 5 .

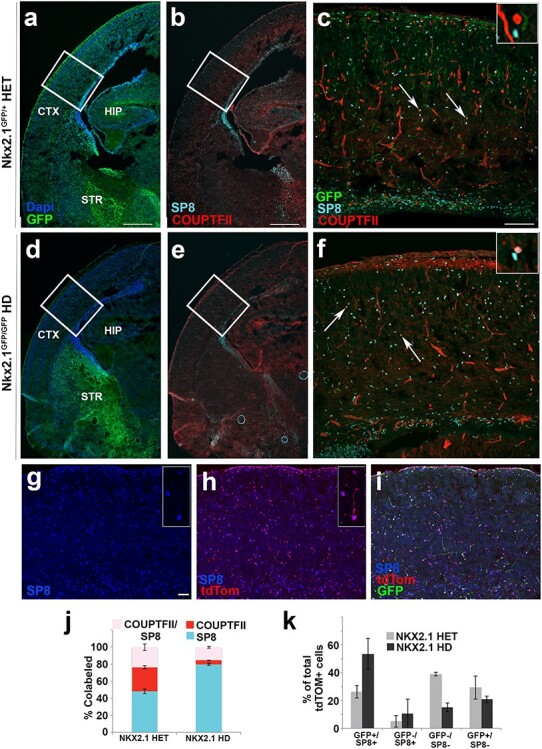
Isl1-derived tdTomato+ cortical cells express SP8 positivity in cerebral cortex. Low magnification coronal sections of (a) Nkx2.1GFP/+ heterozygous and (d) Nkx2.1GFP/GFP HD mice sacrificed at E18.5 show presence and absence of GFP+ cortical cells in (a) and (d), respectively. Co-staining of GFP+ tissue with TFs, SP8 (cyan), and COUPTF-II (red; b,e). High magnification images of boxed regions depicted in (a,b) are shown in (c); (d,e) are shown in (f). Arrows point to co-labeled SP8+/COUPTF+ (pink) cells that differentiate from SP8 only (cyan) and COUPTF-II only (red) (see inset). Confocal images (g–i) of Isl1cre/+:tdTomato; Nkx2.1GFP/GFP (HD) mice at E18.5 showed that many of tdTomato+ cells were re-specified to SP8+ cell fates in cerebral cortex following HD of NKX2.1. Stacked bar graph (j) shows co-expression of SP8 and COUPTF-II in Nkx2.1 HET & HD conditions. HET animals contain 48.1% ± 2.5 (SP8 only), 28.2% ± 1.8 (COUPTF-II only), and 23.7% ± 3.8 (co-labeled) cells, whereas HD animals contain 80.0% ± 1.3 (SP8 only), 4.6% ± 0.3 (COUPTF-II only), and 15.4% ± 1.2 (co-labeled) cells in cortical layers II–VI. N = 7 (HET) & N = 6 (HD), (2-way ANOVA, P < 0.0001). (k) Bar graph shows quantification of fluorescent cells present in cortical layers II–VI for HET and HD conditions whereby tallied cells are quantified relative to total number of tdTomato+ cells revealing 26.2% ± 2.2 (GFP+/SP8+ cells) in HET condition contrasted by 53.6% ± 6.3 (GFP+/SP8+ cells) in HD condition indicating trend. N = 4 (HET) & N = 3 (HD) for bar graphs. Scale bars represent 500 μm (a,b,d,e); 100 μm (c,f) and 50 μm (g–i).
