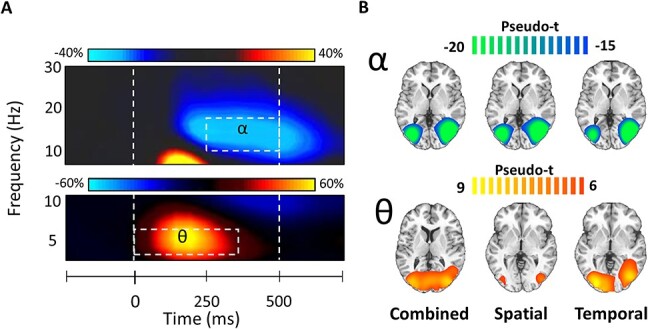
Figure 2 .

Grand averaged sensor-level time–frequency spectrograms and beamformer images for alpha and theta oscillatory responses. (A) Time–frequency spectrograms from representative sensors near occipitoparietal cortices showing oscillatory alpha (top; MEG2513 channel; 10–16 Hz; 250–500 ms; P < 0.001) and theta (bottom; MEG2313; 3–6 Hz; 0–350 ms; P < 0.001) responses averaged across trials and participants. Time is denoted on the x-axis and frequency is on the y-axis. The dotted line to the left (at 0 ms) indicates the onset of the attentional cue and the dotted line to the right (at 500 ms) represents the onset of the target stimulus for the shortest possible spatial cue duration (i.e., 900 ± 400 ms). Color bars above each spectrogram shows the percent change from baseline. (B) The desynchronization or decrease in alpha power was generated by neural populations in the bilateral occipital cortices, whereas synchronizations or increases in theta emerged from bilateral primary visual cortices. The color scale bar above each row of average maps indicates the response amplitude scale (in pseudo-t).
