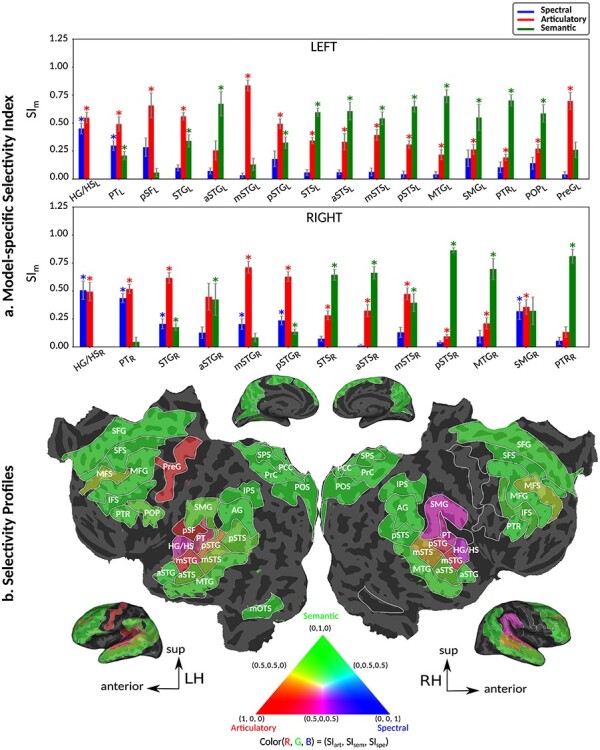
Figure 4 .

Selectivity for multilevel speech features. (a) “Model-specific selectivity indices.” Single-voxel prediction scores on passive-listening data were used to quantify the selectivity of each ROI to underlying model features. Model-specific prediction scores were averaged across speech-selective voxels within each ROI and normalized such that the cumulative score from all models was 1. The resultant measure was taken as a model-specific selectivity index, ( ).
).  is in the range of [0, 1], where higher values indicate stronger selectivity for the underlying model. Bar plots display
  for spectral, articulatory, and semantic models (mean ± standard error of mean (SEM) across subjects). Significant indices are marked with * (P < 0.05; see Supplementary Fig. 3a–e for selectivity indices of individual subjects). ROIs in perisylvian cortex are displayed (see Supplementary Fig. 2 for nonperisylvian ROIs; see Materials and Methods for ROI abbreviations). ROIs in LH and RH are shown in the top and bottom panels, respectively. POPR and PreGR that did not have consistent speech selectivity in individual subjects were excluded (see Materials and Methods). (b) “Intrinsic selectivity profiles.” Selectivity profiles of cortical ROIs averaged across subjects are shown on the cortical flatmap of a representative subject (S4). Significant articulatory, semantic, and spectral selectivity indices of each ROI are projected to the red, green, and blue channels of the RGB colormap (see Materials and Methods). This analysis only included ROIs with consistent selectivity for speech features in each individual subject. Medial and lateral views of the inflated hemispheres are also shown. A progression from low–intermediate to high-level speech representations are apparent across bilateral temporal cortex in the superior–inferior direction; consistently in all subjects (see Supplementary Fig. 4 for selectivity profiles of individual subjects). Meanwhile, semantic selectivity is dominant in many higher-order regions within the parietal and frontal cortices (bilateral AG, IPS, SPS, PrC, PCC, POS, PTR, IFS, SFS, SFG, MFG, and left POP) (P < 0.05; see Supplementary Fig. 3a–e). These results support the view that speech representations are hierarchically organized across cortex with partial overlap between spectral, articulatory, and semantic representations in early to intermediate stages of auditory processing.
