
Figure 7 .
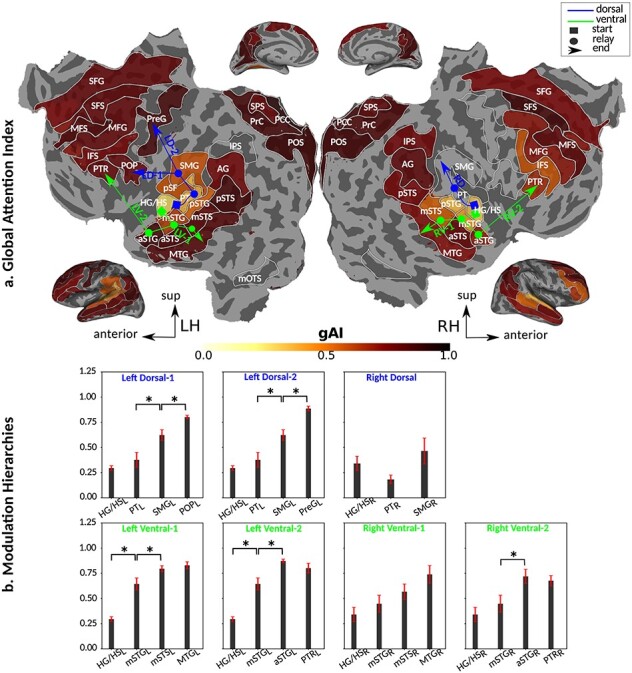
Global attentional modulation. (a) “Global attention index.” To quantify overall modulatory effects on selectivity across all examined feature levels, global attentional modulation ( ) was computed by summing spectral, articulatory, and semantic attention indices (see Materials and Methods).
  is in the range of [−1,1] and a value of zero indicates no modulation. Colors indicate significantly positive
  averaged across subjects (see legend; see Supplementary Fig. 10 for bar plots of
  across cortex). Dorsal and ventral pathways are shown with blue and green lines, respectively: left dorsal-1 (LD-1), left dorsal-2 (LD-2) and right dorsal (RD), left ventral-1 (LV-1), left ventral-2 (LV-2), right ventral-1 (RV-1) and right ventral-2 (RV-2). Squares mark regions where pathways begin; arrows mark regions where pathways end; and circles mark relay regions in between. (b) “Modulation hierarchies.” Bar plots display
  (mean ± SEM across subjects) along LD-1, LD-2, RD, LV-1, LV-2, RV-1 and RV-2, shown in separate panels. Significant differences in
  between consecutive ROIs are marked with brackets (P < 0.05, bootstrap test; see Supplementary Fig. 11 for single-subject results). Significant gradients in
  are
are  in LD-1,
  in LD-2,
  in LV-1,
  in LV-2, and
  in RV-2. In the LH,
  gradually increases from early auditory regions to higher-order regions across the dorsal and ventral pathways. Similar patterns are also observed in the right hemisphere, although the gradients in
  are less consistent across subjects.