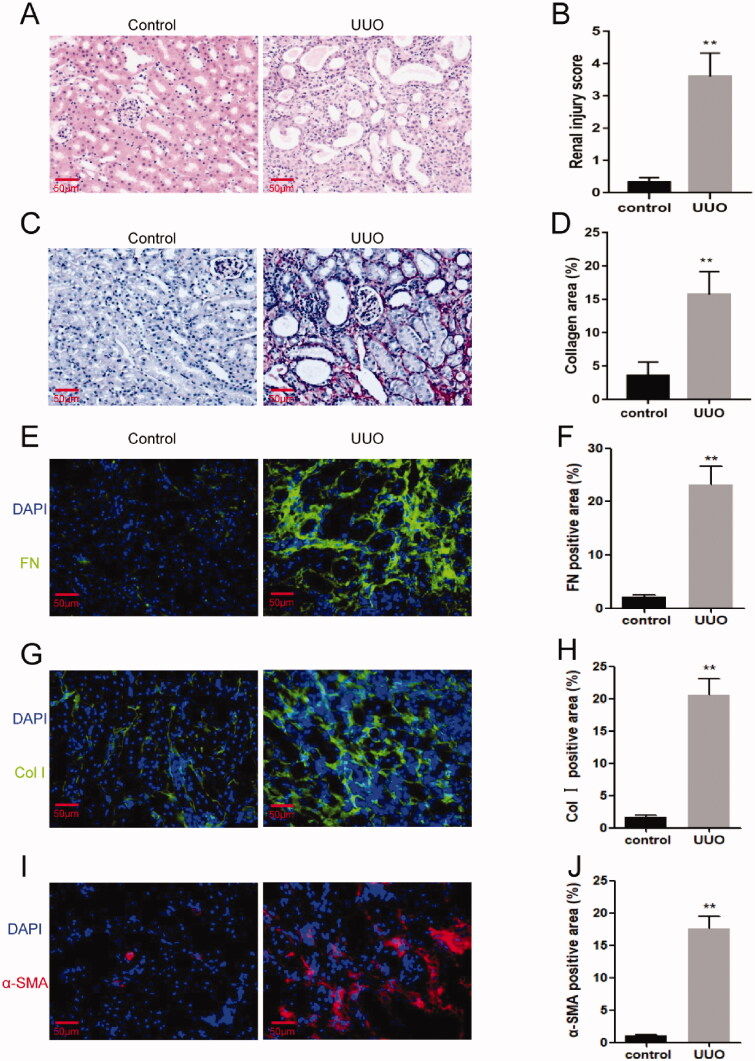
Figure 2.
UUO model was conducted successfully. (A) H&E staining for kidneys of UUO mice or control mice. (B) Sirius red staining for kidneys of UUO mice or control mice. (C) Quantitative assessment of renal injury in the kidneys of UUO mice or control mice. (D) Quantitative assessment of collagen areas in the kidneys of UUO mice or control mice. (E) Representative photomicrographs of kidney sections stained for Fibronectin (green) and counterstained with DAPI (blue). (F) Quantitative analysis of the fibronectin-positive area in the kidneys. (G) Representative photomicrographs of kidney sections stained for collagen I (green) and counterstained with DAPI (blue). (H) Quantitative analysis of collagen I-positive area in the kidneys. (I) Representative photomicrographs of kidney sections stained for α smooth muscle actin (α-SMA; red) and counterstained with DAPI (blue). (J) Quantitative analysis of the α-SMA-positive area in the kidneys. **p < 0.01 versus control. n = 3 in each group. Scale bar: 50μm.

