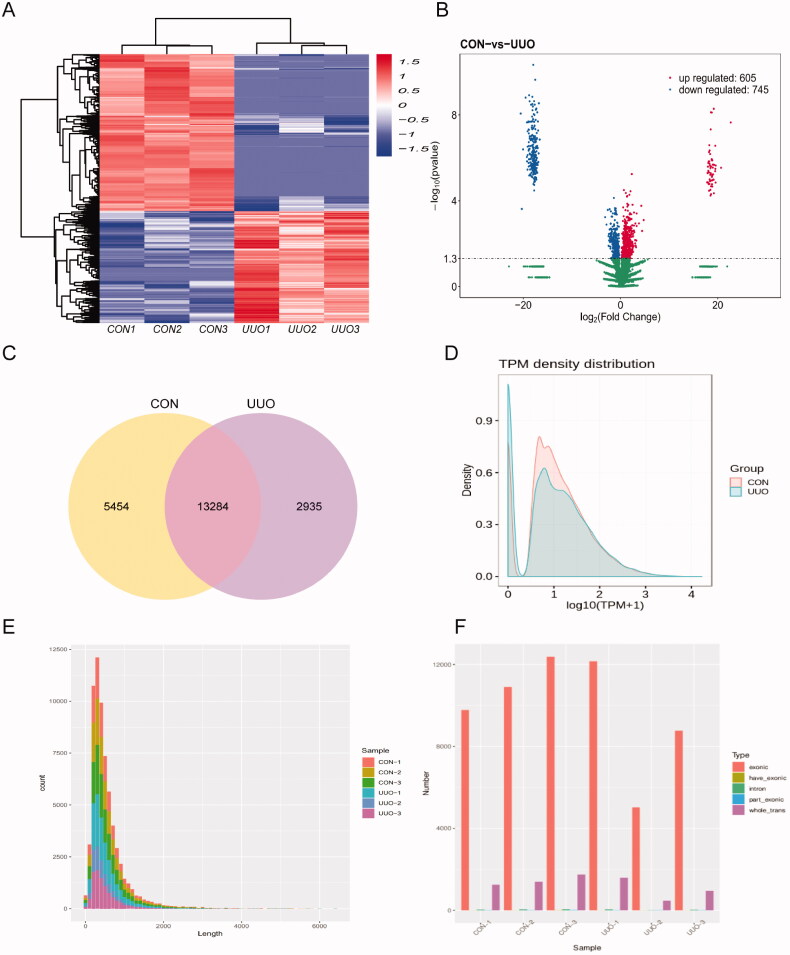
Figure 3.
The circRNAs in mouse kidney. (A) Heat map generated by hierarchical clustering of differentially expressed circRNAs in UUO and control samples, red representing high read counts of circRNAs and blue for low expressed circRNAs. (B) The volcano plot shows the total change circRNAs in each group, left shows those down-regulated and right for up-regulated circRNAs. (C) Among detected circRNAs, 5454 and 2935 circRNAs were detected in the control and UUO group, respectively, and 13284 circRNAs were detected in both groups. (D) The TPM distributions of circRNAs. (E) The distribution of the sequence length of circRNAs. (F) The distribution of circRNAs host genes in all chromosomes, most are form exon.

