
Figure 3. FTLD-Tau or rTg4510 mouse brain-derived PHFs induce inflammasome activation in an ASC-dependent manner.
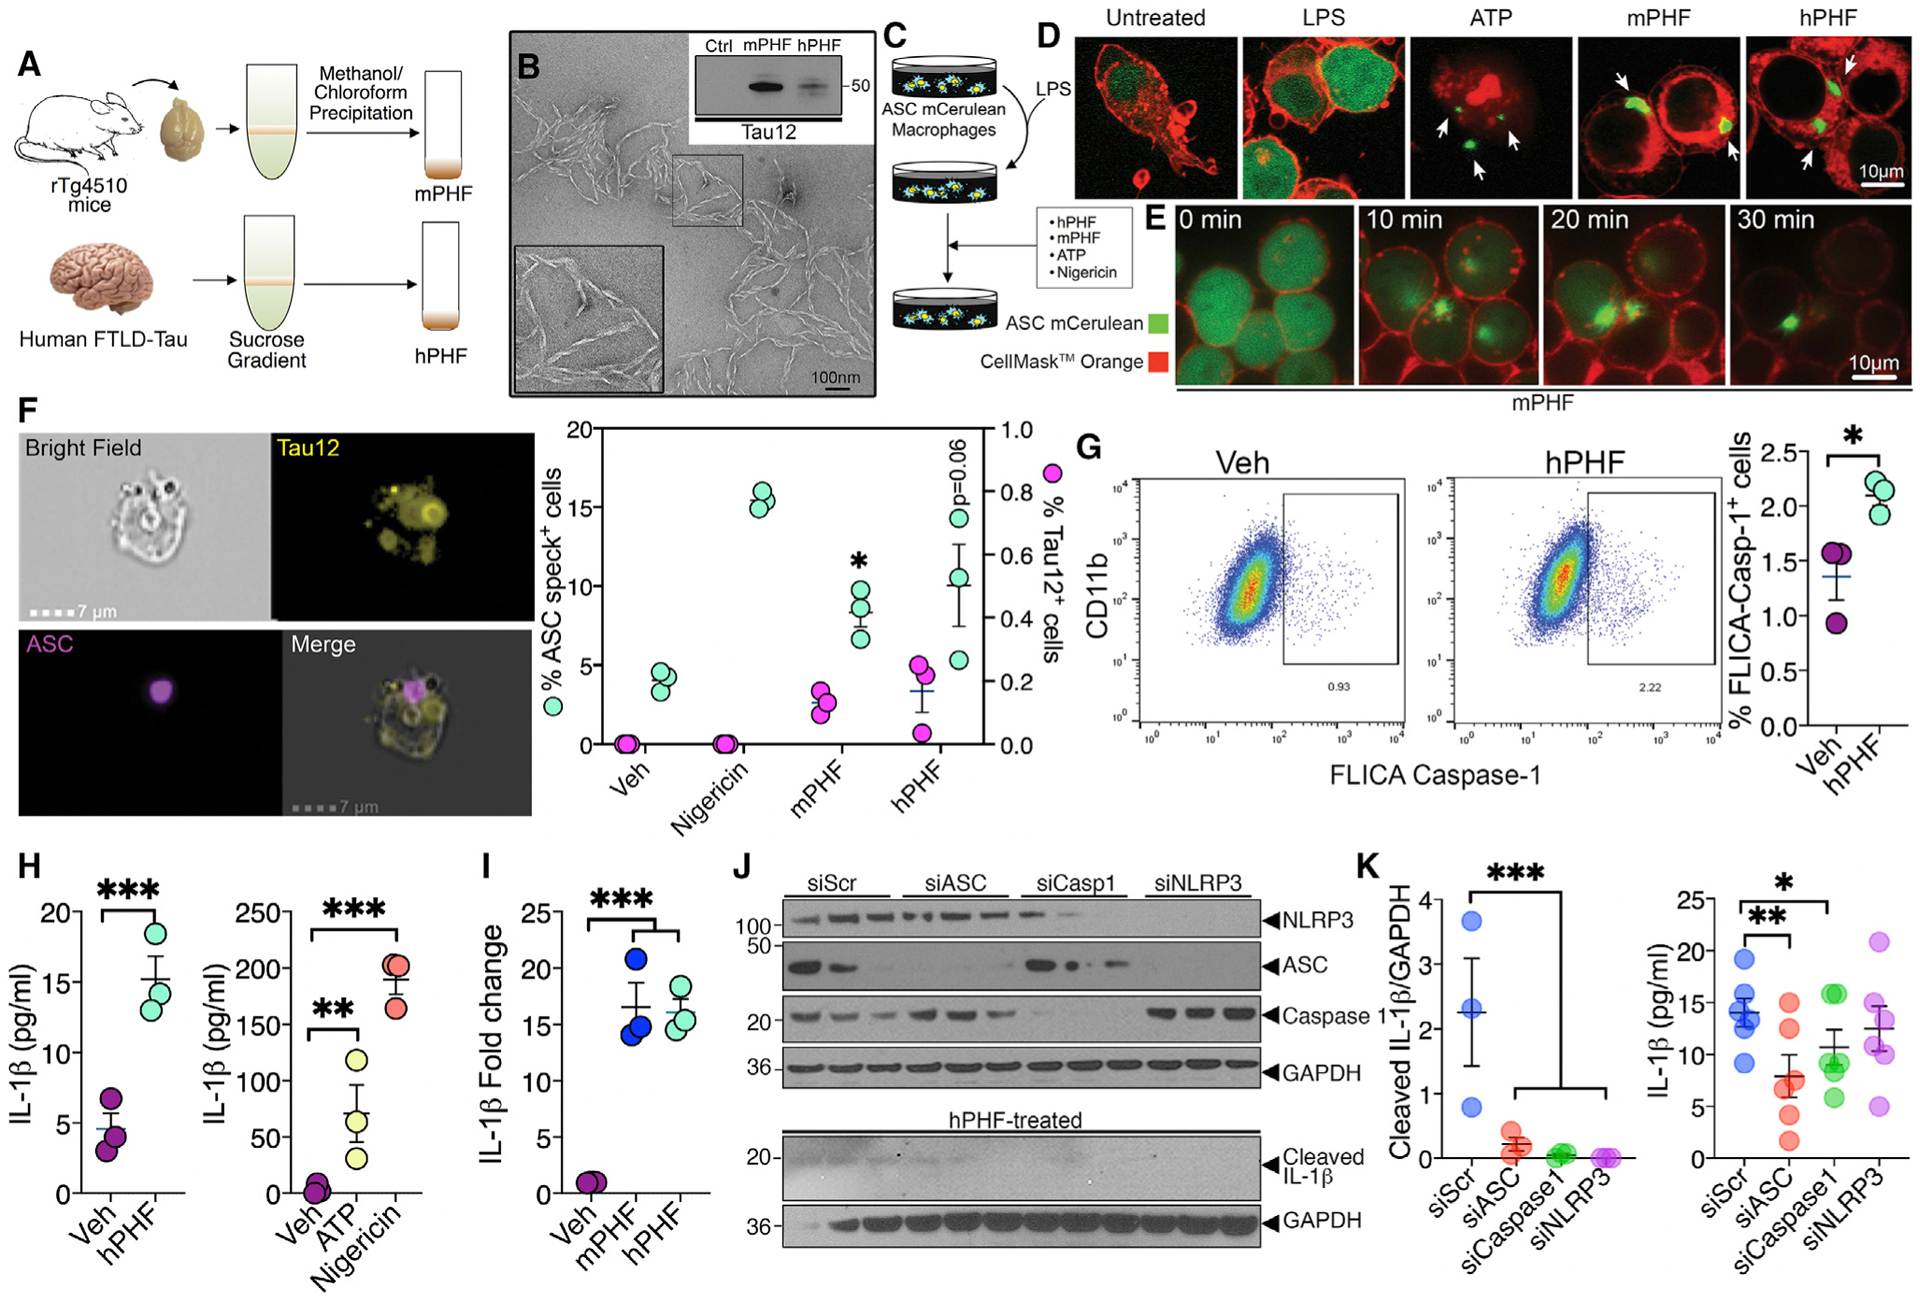
(A) Schematic of the Sarkosyl insoluble assay followed by sucrose gradient centrifugation and methanol/chloroform precipitation for the purification of mouse PHFs (mPHFs) and human PHFs (hPHFs) or the vehicle (VEH).
(B) Transmission electron microscopic image shows helical conformation of purified hPHF. Both mPHFs and hPHFs were reactive to human tau (Tau12) antibody (western blot inset). Scale, 100 nm.
(C–E) LPS-primed ASC-mCerulean macrophages show speckling of ASC (arrows) similar to ATP (positive control) when treated with 2 μg/mL h/m-PHF within 30 min. Scale, 10 μm.
(F) Amnis ImageStream flow-cytometry and microscopic analysis shows significant increase in the percentage of cells with ASC-specks following PHF treatment in unprimed ASC-mCerulean macrophages. Scale, 7 μm.
(G) Flow-cytometric based FAM-FLICA caspase 1 assay shows >2-fold increase in the percentage of CD11b+/FLICA-Caspase-1+ BV2 cells with hPHF treatment.
(H) ELISA analysis shows 3-fold increase in the secreted (active) IL-1β in the cell supernatant of hPHF-treated (2 μg/mL for 18 h), unprimed ASC-mCerulean macrophages compared to vehicle treatment. ATP- and nigericin-induced maturation of IL-1β shown as positive controls.
(I) Unprimed and mPHF-/hPHF-treated ASC-mCerulean macrophages show significant increase in IL-1β mRNA.
(J and K) Unprimed, hPHF-treated ASC-mCerulean macrophages show significantly reduced levels of cleaved IL-1β in the supernatant with siRNA against ASC (siASC), caspase 1 (siCaspase 1), or NLRP3 (siNLRP3) compared to siScramble (siScr) by western blot (J and left panel in K) and ELISA analyses (right panel in K).
Data displayed as mean ± SEM, unpaired Student’s t test (F, right), one-way ANOVA with Tukey multiple comparison test (H, right, I, and K–L), *p < 0.05, ***p < 0.0005 with n = 3 (F–I), n = 3–6 (K).