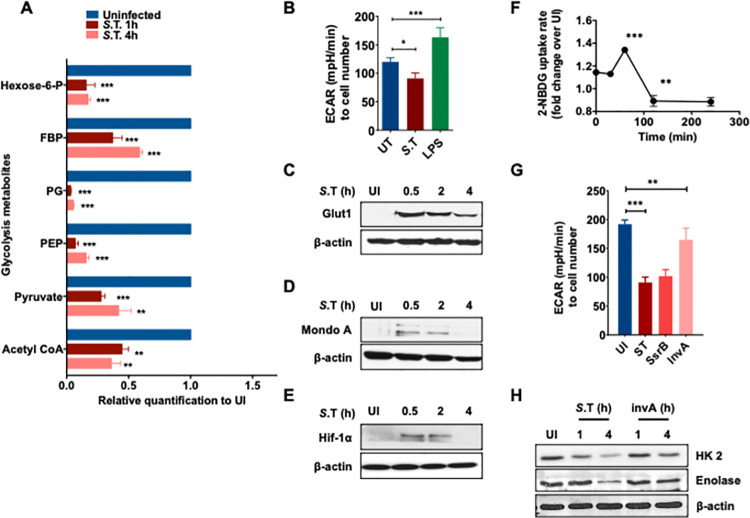
Fig 2. Virulence dependent inhibition of glycolysis in S. Typhimurium infected macrophages.
(A) Abundance of glycolytic metabolites in S. Typhimurium-infected BMDMs after 1 h and 4 h p.i relative to uninfected (UI) BMDMs (n = 6). (B) Extracellular Acidification Rate (ECAR) in BMDMs upon S.T infection or LPS treatment. Data is normalized to cell number (n = 3). (C) Western blot analysis of Glut1 (D) MondoA (E) HIF-1alpha expression at indicated time points upon S. Typhimurium-infected BMDMs compared to uninfected controls. β-actin was used as a loading control. The image shown is representative of 4 independent experiments. (F) Kinetics of glucose-intake (shown as 2-NBDG MFI) in S. Typhimurium-infected BMDMs relative to uninfected (UI) BMDMs analyzed by flow cytometry (n = 3). (G) Extracellular Acidification Rate (ECAR) in BMDMs infected upon WT, ssrB, and invA mutant S. Typhimurium infection. Data is normalized to cell number (n = 6). (H) Immunoblot analysis of the protein levels of HexoKinase-2 (HK2, Enolase, and β-actin upon WT and InvA mutant S. Typhimurium infection.

