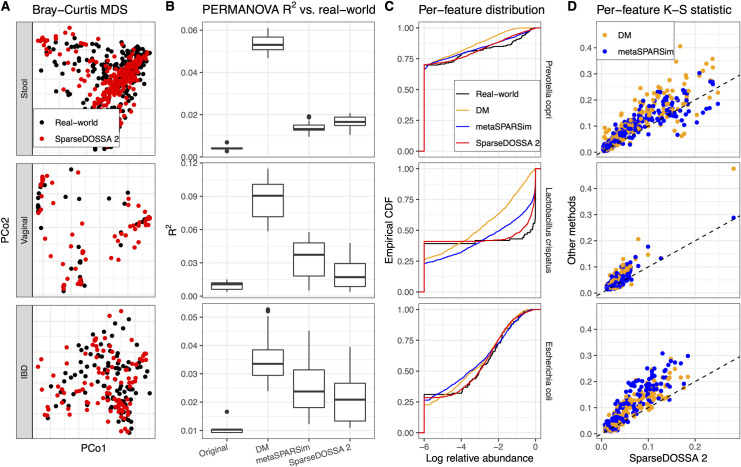
Fig 2. SparseDOSSA accurately recapitulates different microbial community structures.
We compared SparseDOSSA 2 simulated microbial counts versus those of three human microbiome training template datasets (Stool, Vaginal, and IBD). A) Bray-Curtis ordination shows global agreement between SparseDOSSA simulated microbial abundance profiles and those of their originating real-world populations. B) This was quantified by PERMANOVA R2 statistics, showing that SparseDOSSA simulated samples were significantly less systematically differentiated from their targets than existing DM and metaSPARSim methods in almost all cases (Wilcoxon rank sum test p-values included in S3 Table). R2 compared against randomly split original real-world data are included as baseline controls. C) Representative features from each environment are similarly distributed between real-world and SparseDOSSA simulated samples, as shown in empirical cumulative distribution functions (CDFs) of log-10 relative abundances (with pseudo value 1e-6 to visually represent zeros). D) Per-feature Kolmogorov-Smirnov summary statistics quantify that SparseDOSSA outperforms existing methods in simulating realistic feature-level relative abundance distributions. First, the similarity between the model-simulated feature abundance distribution versus that in the real-world dataset is quantified with K-S statistics. Then, the K-S statistics for SparseDOSSA and the other two models (DM and metaSPARSim) are plotted on the x- and y-axis, respectively (each point representing one feature, smaller K-S statistics represent better approximation). Lastly, the K-S statistics of SparseDOSSA versus other models are formally tested using Wilcoxon signed rank tests (p-values are significant and included in S4 Table).

