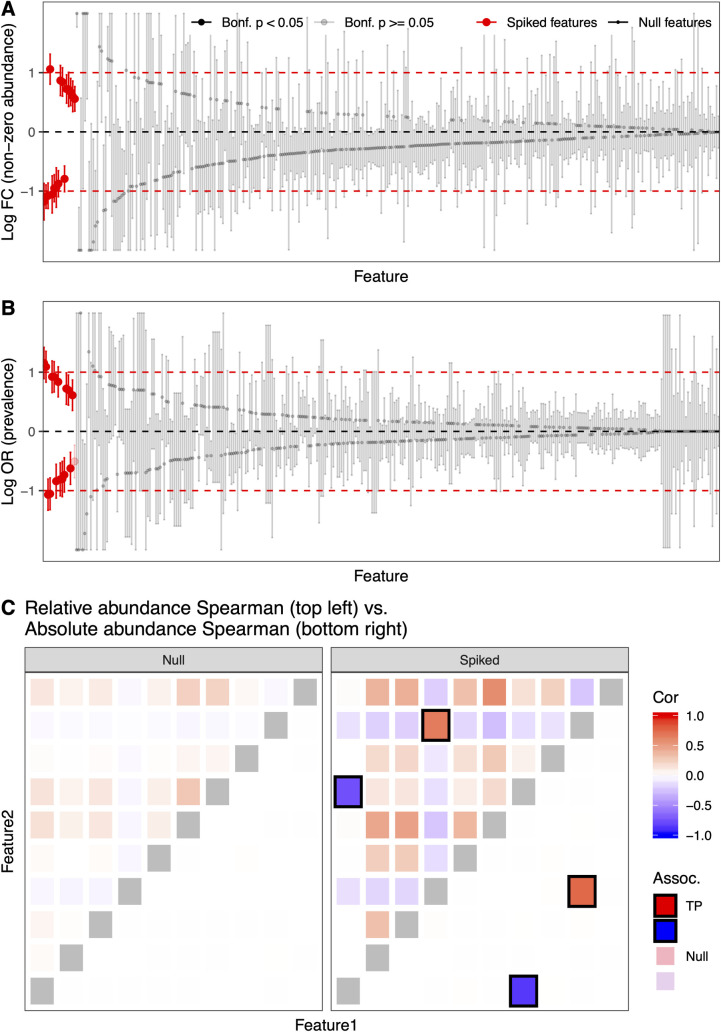
Fig 3. SparseDOSSA can add feature-phenotype and feature-feature associations to modeled microbial community simulations.
A,B) SparseDOSSA 2 correctly simulated feature-phenotype associations targeting the prescribed non-zero relative abundance (A) and prevalence (B) effect sizes of the spiked features, while maintaining non-associations of null features. True associated (spiked) microbial features (red) are well differentiated from null features (black), through Bonferroni corrected p-values (non-significant features marked in gray; test based on linear/generalized linear regression against the spiked metadata variable, see Methods for details). The horizontal dashed lines indicate true spike-in effect sizes: red lines for the positive and negative true effect sizes, respectively, and the black line for null effect (0). C) SparseDOSSA can also prescribe feature-feature associations. Bottom right triangles are Spearman correlations in the simulated absolute abundances. As prescribed, only true association feature pairs are correlated. Top right triangles are Spearman correlations in the corresponding, simulated relative abundances. Note that in this example, Spearman correlation does not differentiate between true (“biological”) covariations versus those induced spuriously due to compositionality (as is also the case in the underlying data on which SparseDOSSA’s model is fit). As expected, both true signals and spurious correlations caused by compositionality can be observed for such data. TP: true positives.

