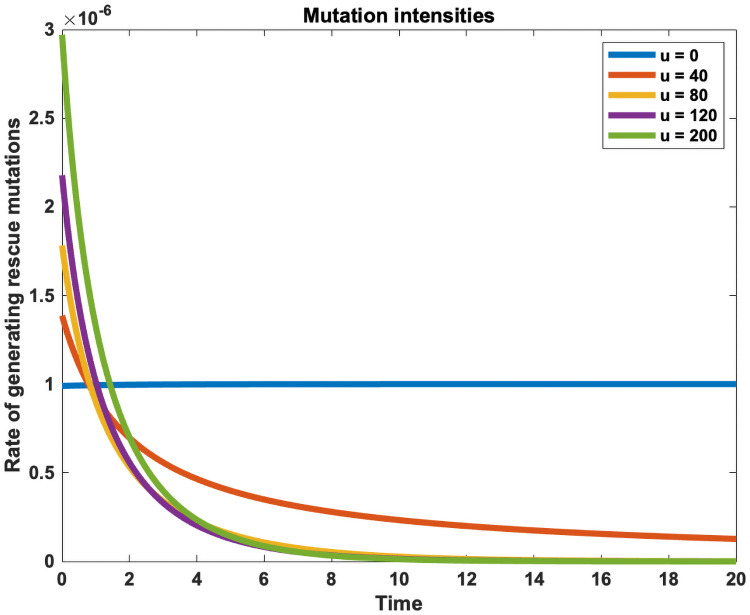
Fig 2. Time-dependent mutation rate profiles.
Each treatment strategy u(t) leads to a characteristic mutation intensity profile S(t, u(t))μ(u(t)), which gives the rate of gaining a rescue mutant as a function of time. If no treatment is administered (u(t) = 0), the population grows to its carrying capacity and generates rescue mutations at a constant baseline mutation rate (blue). A dose-dependent mutation rate introduces a trade-off, where treatment can be used to decrease the population size only at the expense of simultaneously increasing the mutation rate. This creates a sharp mutation peak at the beginning, when treatment is applied to a large population size. The optimal treatment strategy, which minimises the probability of evolutionary rescue, exploits this trade-off by balancing the early mutational peak such that the area under intensity profile is minimised. The plotted intensity profiles were generated using the constant doses given in the legend and the same model and parameters as given in the Methods section (Eq 7 and Table 1).

