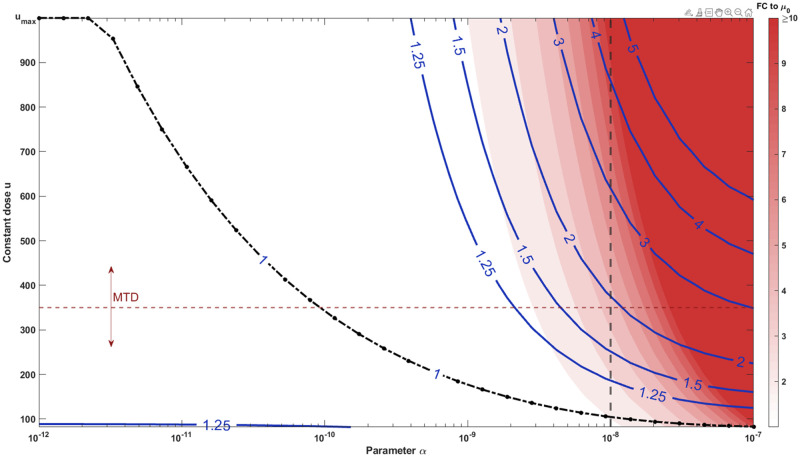
Fig 3. Optimal therapies substantially reduce the number of resistance mutations generated compared to MTD.
The costs of constant therapies C(u;α) were evaluated while varying the key parameter α, which quantifies the strength of dose-dependent mutation rate. The plotted contour lines correspond to the cumulative mutation intensities (the expected number of rescue mutants) relative to the optimal constant treatment C(u;α)/C(u*;α). Thus, the 1-isoline (drawn as black dash-dot line for emphasis) gives the optimal constant dose as a function of the parameter α, while the 2-isoline gives the cases where the corresponding MTD produces 100% more rescue mutations than the optimal dose. The red background color indicates the assumed fold change (FC) to the baseline mutation rate. We notice that substantial improvements are possible even for modest fold-changes depending on how well the drug is tolerated (how close the MTD is to umax). The probability of evolutionary rescue scales exponentially in the amount of the rescue mutations. We consider the case α = 10−8 in detail, which corresponds to the cases given by the vertical dashed line. Similarly, the horizontal dashed line corresponds to the MTD used in stochastic simulations.

