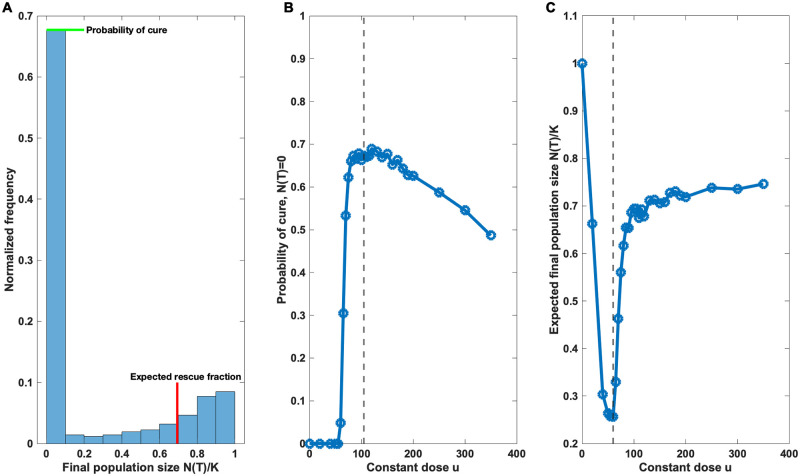
Fig 4. Non-monotonic dose responses.
nsim = 2000 constant therapies were simulated for each dose while recording the final population sizes N(T). A Example of a bimodal distribution of the normalized final population sizes N(T)/K using the optimal constant dose u = 104.5 that minimises the rescue probability (cost function Eq (3)). The zero mode corresponds to the proportion of extinct populations (cure) and the second mode corresponds to the expected size of the rescued population. Each dose leads to its own characteristic bimodal distribution. B The proportion of extinct populations N(T) = 0 plotted as a function of dose. The probability of cure displays non-monotonicity and is maximised in the neighborhood of the optimal dose u = 104.5 (dashed line), which was determined analytically using the stationary Eq (5). C The mean final population sizes of the rescued populations N(T)/K plotted as a function of dose (the extinct populations were excluded). The expected rescue size is minimised at u = 60 (dashed line), which agrees to the numerical solution S3 Fig of the discounted problem Eq (4).

