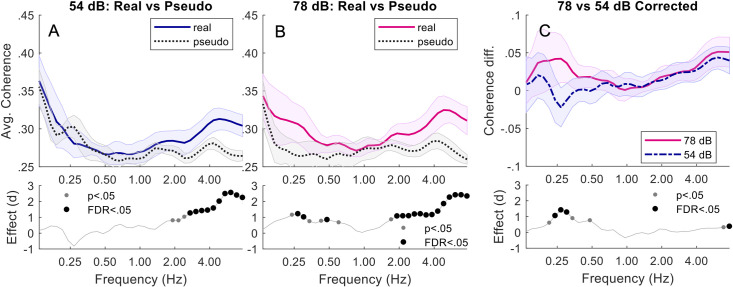
Fig 3. Triads in speech-shaped noise.
Top plots of (A) and (B) show the average wavelet coherence responses for Real vs Pseudo during 54 dB and 78 dB respectively. The mean coherence over all triads (with standard error) is shown across a range of frequencies. The lower plots show the corresponding Pseudo-Real effect size (Cohen’s d), with both significance and FDR-adjusted significance. (C) shows the corrected (baseline removed) coherence difference between 78 and 54 dB.

