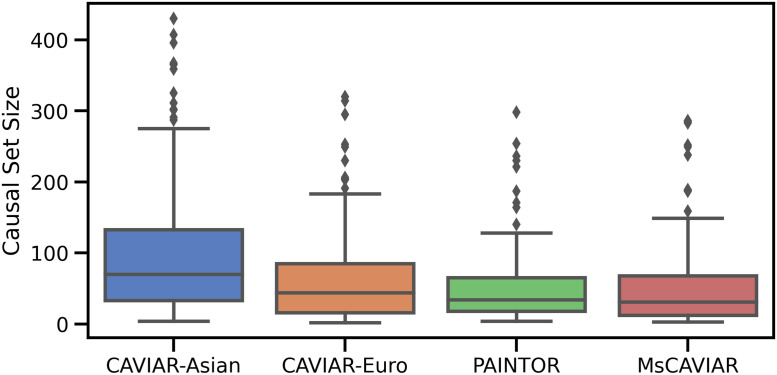
Fig 3. Comparing fine mapping resolution in trans-ethnic HDL analysis.
Comparison of the results of MsCAVIAR when applied to 185 loci from two high-density lipoprotein (HDL) GWAS, White European people from the UK Biobank [23, 24] and Japanese people from Biobank Japan [27, 28], versus trans-ethnic PAINTOR [15] and applying CAVIAR [8] to each population individually. The y-axis is the size of the causal set for each locus. The boxes represent the interquartile range of causal set sizes identified by each tool, the lines inside the boxes represent the median, and the whiskers extend to the non-outlier extremes. Outliers are represented as dots above or below the whiskers.

