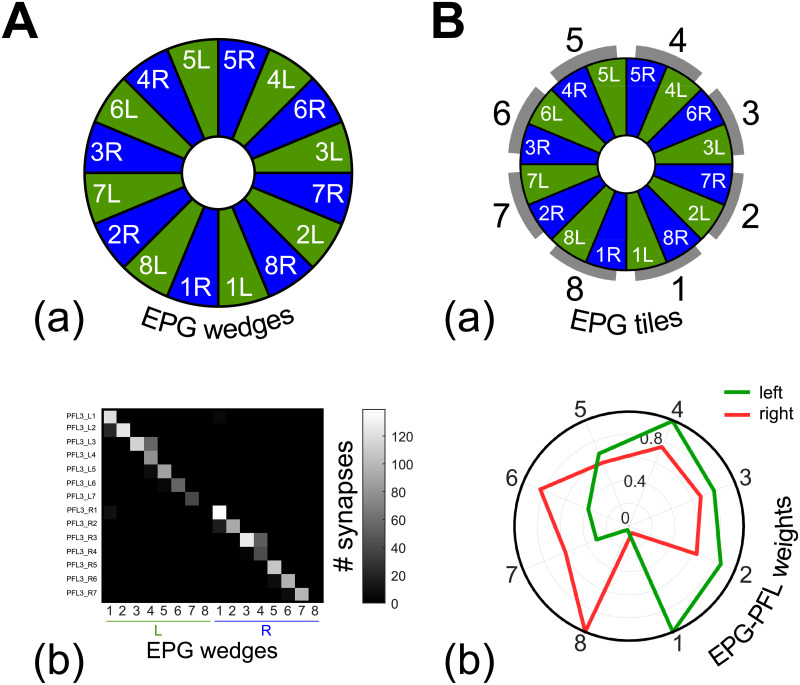
Fig 4. The EPG to PFL3 connectome at the interface between the compass and the steering control.
The full connectome is assessed from online Drosophila brain databases (https://v2.virtualflybrain.org, [35–38]). The full list of the synaptic connection between neurons annoted PFL3 and EPGs is given in S1 Table. A. (a) Division of the EB in wedges 15. (b) Quantity of synapses expressed as a function of the EB wedges and the PFL3 columns. B. (a) Relationship between EB wedges and the EPGs modeled here (Fig 3A). (b) The connectome is transformed into EPG-PFL3 synapse weights to create the steering model (see section 2.5). Weights are obtained by summing for each EPG the synapses on the right or on the left part of the PB. The gains are then normalized to fit between 0 and 1.

