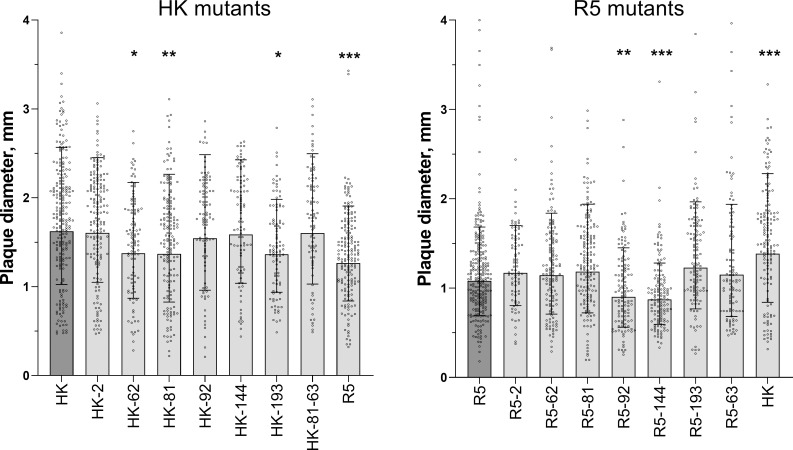
Fig 6. Diameter of plaques formed by viruses in MDCK cells.
Cells in six-well plates were inoculated, incubated under semi-solid overlay medium for 48 h at 37°C, fixed and immunostained. Two panels represent two groups of viruses tested separately. Data were analysed after log-transformation using a general mixed model including a random intercept term accounting for day-to-day variation between experiments as described in Materials and Methods. Each panel shows diameters of individual plaques adjusted for day, geometric mean (bars) and geometric SDs from 1 to 4 experiments performed on different days. Asterisks depict P values for the differences between the mutants and the corresponding parental virus (HK in the left panel and R5 in the right panel).

