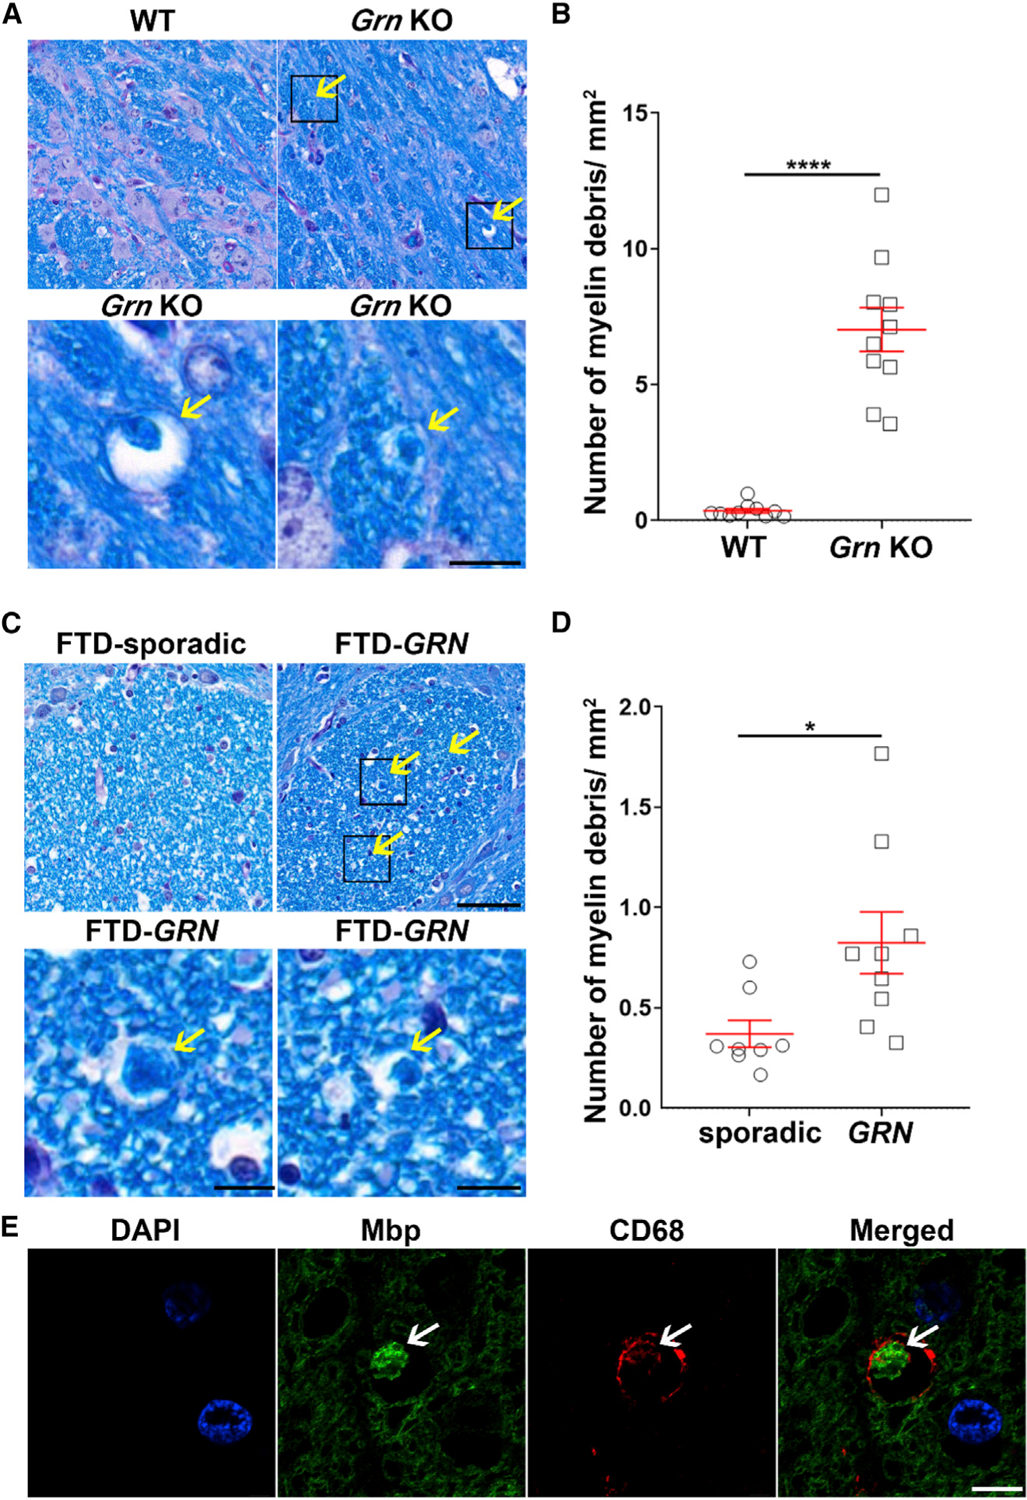
Figure 2. Myelin debris accumulates in Grn KO mice and in patients with GRN-associated FTD.

(A–D) Representative images (A and C) and quantitative analysis (B and D) of myelin staining (LFB) in the pons of 21-month-old WT or Grn KO mice (n = 10 per group) (A and B) and in the pons of patients with sporadic FTD and patients with GRN-associated FTD (n = 8–9 per group) (C and D). Arrows indicate myelin debris. Scale bar, 50 μm. Boxes in (A) and (C) indicate the region enlarged below. Data in (B) and (D) are presented as mean ± SEM. *p < 0.05, ****p < 0.0001, unpaired Student’s t tests.
(E) Representative images of myelin (MBP) and microglial lysosome (CD68) co-staining in pons of patients with GRN-associated FTD. Arrow indicates myelin debris. Scale bar, 5 μm.
