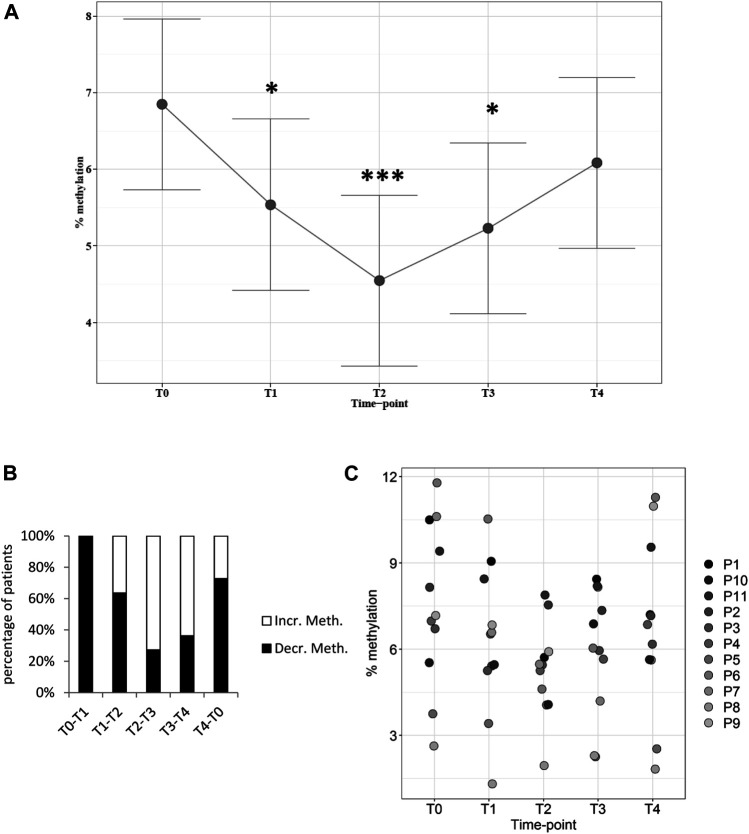
FIGURE 1.
Global DNA methylation levels in patients at different time-points. (A): Plot of the least square predicted means with 95% confidence intervals. The predicted least square means were calculated using a 1-way repeated measures mixed model. *p < 0.05; ***p < 0.001 in planned comparisons with T0 levels. (B): variation in methylation levels between time-points. The percentage of patients showing increased (Incr. Meth.) or decreased (Decr. Meth.) methylation levels with respect to the previous time-point is shown. (C): DNA methylation levels in each patient at every time-point. n = 11 patients repeatedly assessed at 5 time-points.

