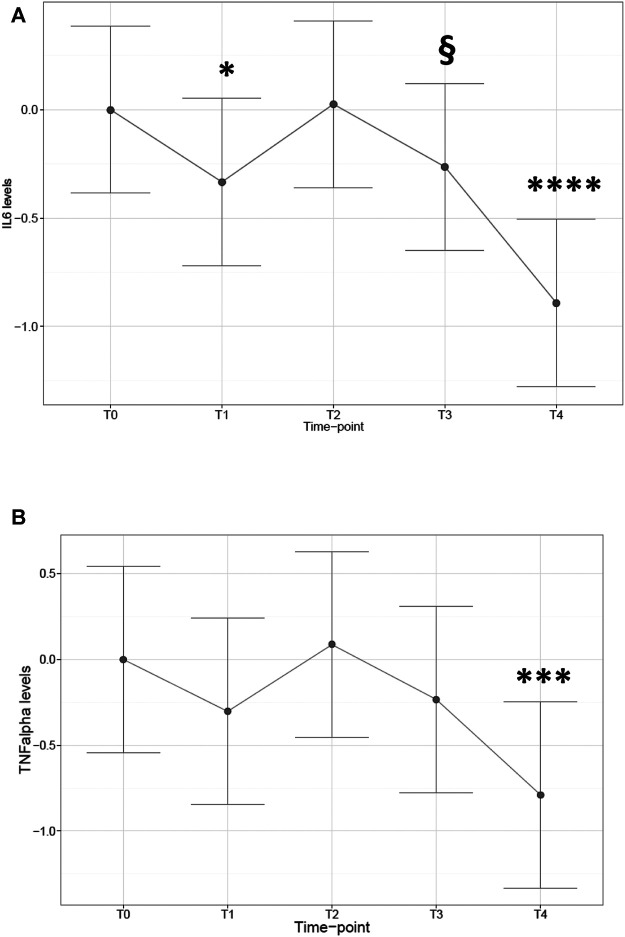
FIGURE 3.
Cytokine mRNA expression in patients at different time-points. Plot of the least square predicted means with 95% confidence intervals. The predicted least square means were calculated using a 1-way repeated measures mixed model. (A): IL6; (B): TNFα. Ordinate axis is displayed on the Log10 scale. *p < 0.05; ***p < 0.001; ****p < 0.0001; §0.05 < p< 0.1 in planned comparisons with T0 levels. n = 11 patients repeatedly assessed at 5 time-points.

