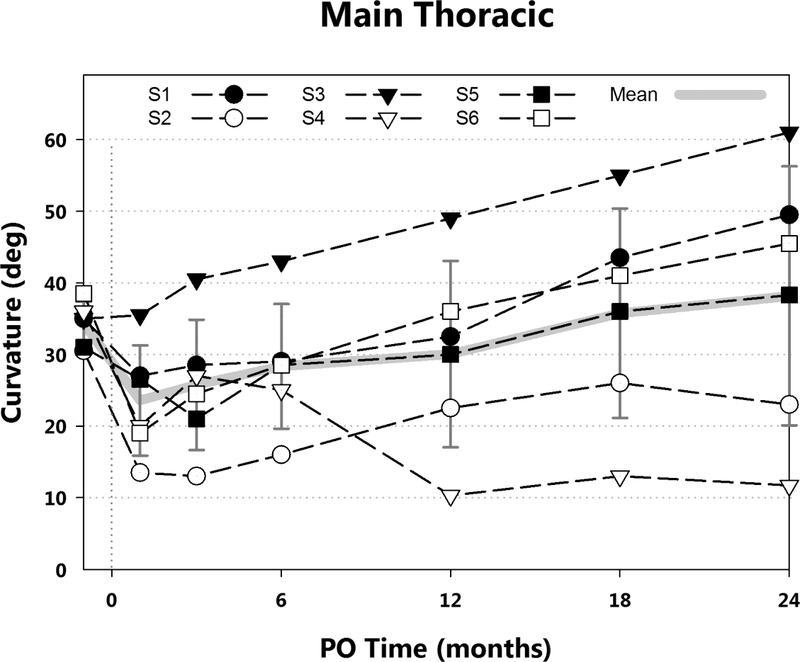
Fig. 3.

Major thoracic curvatures by postoperative (PO) time are shown. Mean and standard deviation (gray), and curvatures for each subject (black) are presented. Variability was high, however, the major curvature at 2 years postoperative remained below surgical fusion (PSF) indications (45° - 50°) in a cohort chosen specifically to have a high probability of progression. Mean intrasubject curvature increase from immediately preoperation to 24 months was less than 5°.
