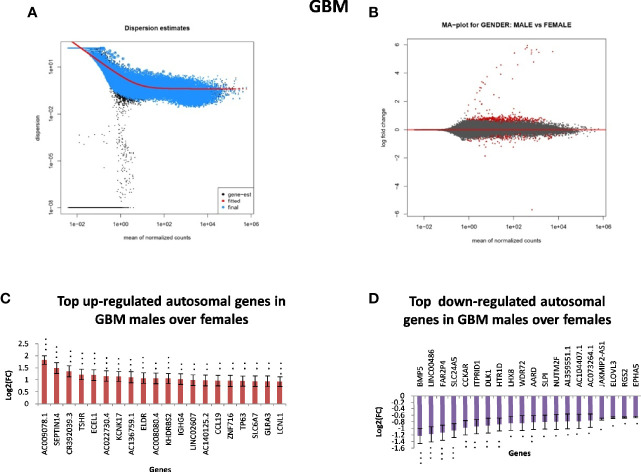
Figure 2.
Gender-based differentially expressed genes in the transcriptomic data [The Cancer Genome Atlas (TCGA)] of glioblastoma multiforme (GBM) in males over females. (A) Dispersion estimate of the count values on performing DeSeq2 analysis. (B) MA Plot showing DeSeq2 result of the differential expression of males over females of TCGA GBM. (C) Graph representing top 20 upregulated genes in males over females and their Log2[fold change (FC)] values in GBM and low-grade glioma (LGG), respectively. (D) Graph representing top 20 downregulated genes in males over females and their Log2(FC) values in GBM 470 *p-value ≤0.05, **p-value ≤0.01, ***p-value ≤0.0001.

