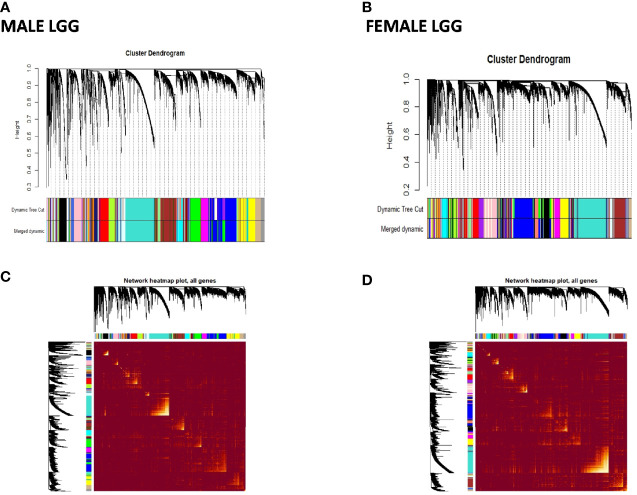
Figure 6.
Visualization of weighted gene co-expression network analysis (WGCNA) results of low-grade glioma (LGG): (A, B) show cluster dendrograms of different modules formed in male and female LGG. A total of 94 and 95 colors representing modules have been identified in LGG of males and females, respectively. (C, D) show network heat map plot of genes of different clusters in male and female LGG, respectively. Heat map depicts the topological overlap matrix among all genes in the analysis. Dark color represents low overlap, and progressively lighter color represents higher overlap. Blocks of lighter color along the diagonal are the modules (n = 288 male and 239 female LGG).

