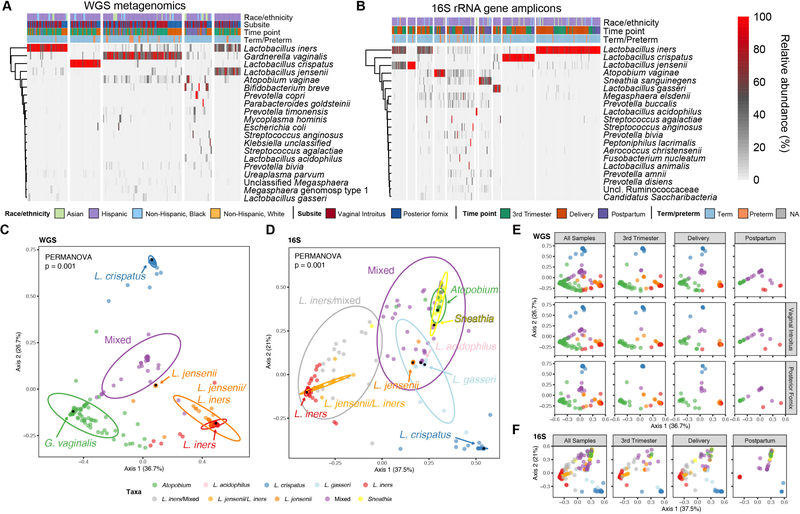
Figure 1.
Characterization of the vaginal microbiome using WGS metagenomics and targeted 16S rRNA gene amplicon sequencing. (A-B) Relative abundance of the top twenty most prevalent microbial species of the vaginal microbiome based on WGS metagenomics and targeted 16S rRNA gene amplicon analysis. (A) WGS metagenomics derived species relative abundances. The 20 most prevalent taxa contribute 94 percent of the total abundance. (B) 16S rRNA ASV derived species level relative abundances. The 20 most prevalent taxa contribute 96 percent of the total abundance. Samples/columns are grouped according to k-means cluster membership and rows are clustered hierarchically using complete linkage. Column annotations indicate race/ethnicity, time point that sample was acquired, vaginal subsite (for WGS metagenomics), and term/preterm outcome; NA indicates not available. (C-D) Vaginal microbiome community structure. (C) Multidimensional scaling (MDS) ordination of Bray-Curtis distance of WGS vaginal samples supports the k-means clustering of five distinct communities (PERMANOVA, p = 0.001; pairwise PERMANOVA, all p = 0.001). (D) MDS ordination of Bray-Curtis distance of 16S rRNA vaginal samples at the species level supports the k-means clustering of ten clusters (PERMANOVA, p = 0.001; pairwise PERMANOVA, all p < 0.05). Samples are color coded according to cluster membership. Arrows/black dots denote landmark samples – samples with the highest relative abundance (in parentheses) of the indicated species. The percentage of variation explained by each axis is shown in parentheses on the x- and y-axis. Ellipses represent 95% confidence intervals.

