. 2021 Sep 6;9(38):21958–21971. doi: 10.1039/d1ta05561e

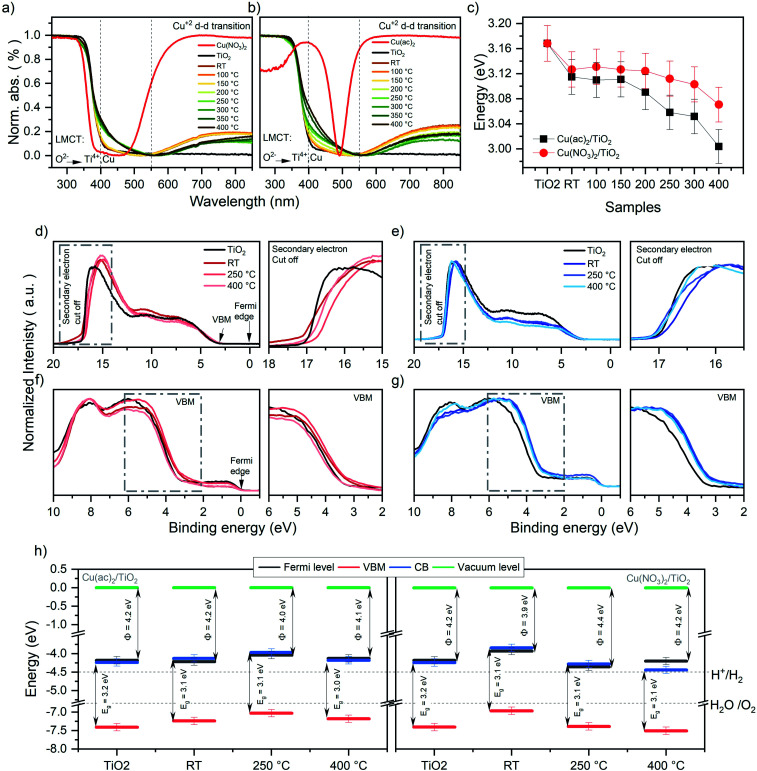
Fig. 5. Normalized DRS data for the (a) Cu(NO3)2/TiO2 and (b) Cu(ac)2/TiO2 composites subjected to various thermal treatments along with the pure anatase TiO2 and the original Cu precursors. (c) Band gap (Eg) values of the Cu(NO3)2/TiO2 and Cu(ac)2/TiO2 composites as a function of post-treatment temperature. The data is extracted via Tauc plot analysis of the DRS spectra. RT = non-calcined sample, LMCT = ligand to metal charge transfer. Further details, absolute values of the composites and thermal evolution of the pure precursors are shown in Fig. S15, S16 and Table S6. (d) UPS signals of Cu(NO3)2/TiO2 and (e) Cu(ac)2/TiO2 composites prepared at different temperatures. (f) VB-XPS of Cu(NO3)2/TiO2 and (g) Cu(ac)2/TiO2 composites. (h) Energy diagram (energy (eV) vs. vacuum level) of Cu(ac)2/TiO2 and Cu(NO3)2/TiO2 constructed from the corresponding UPS, XPS and DRS data (further detail in Fig. S17 and Table S7) of the bare TiO2-anatase, the non-calcined sample and the composites obtained via calcination at different temperature. H+/H2 and H2O/O2 potential values taken at standard conditions.52,53 Note that the values are referenced to the vacuum level (Evac = 0 eV).

Fig. 5