. 2021 Sep 16;10:e67615. doi: 10.7554/eLife.67615

Figure 2. eQTL mapping of SVs.

We used RNA-seq data from the Geuvadis Consortium (Lappalainen et al., 2013), obtained from LCLs derived from individuals from four European and one African population of the 1KGP dataset, to test for associations between SV genotypes and gene expression. SV-eQTL pairs that were significant at a 10% FDR are depicted in purple. (A) Q–Q plot of permutation p-values for all SV-gene pairs tested. (B) Volcano plot of eQTLs and the estimated effect of the alternative allele on expression (β). (C) Distribution of the distance of significant SV eQTLs from the transcription start site (TSS) of their associated genes. (D) Enrichment or depletion of expression associations for SVs that overlap various ChromHMM chromatin state annotations from the Roadmap Epigenomics Project (GM12878 Lymphoblastoid Cells). Chromatin states with ≤0.1% genome-wide representation were omitted for visual clarity.

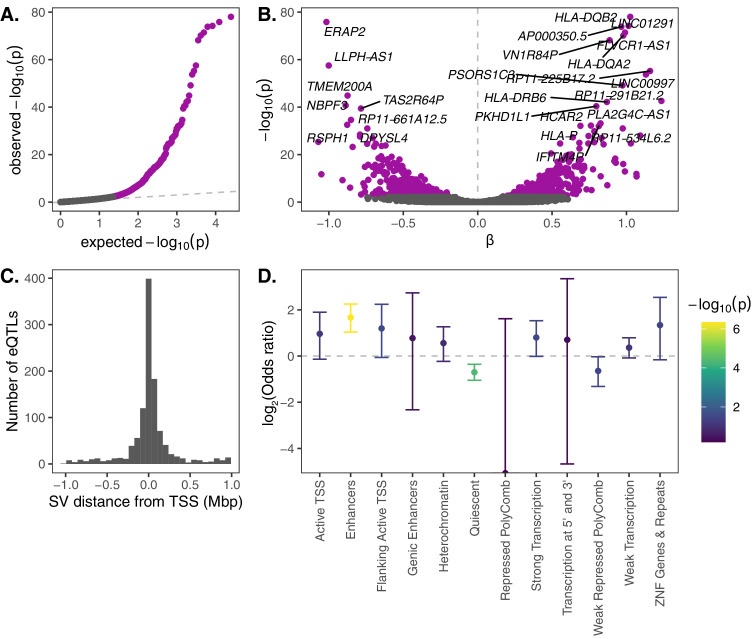
Figure 2—source data 1. Summarized eQTL data underlying Figure 2.
SV IDs, gene IDs and names, distance to the TSS, slopes, p-values, and q-values are provided.

Figure 2.

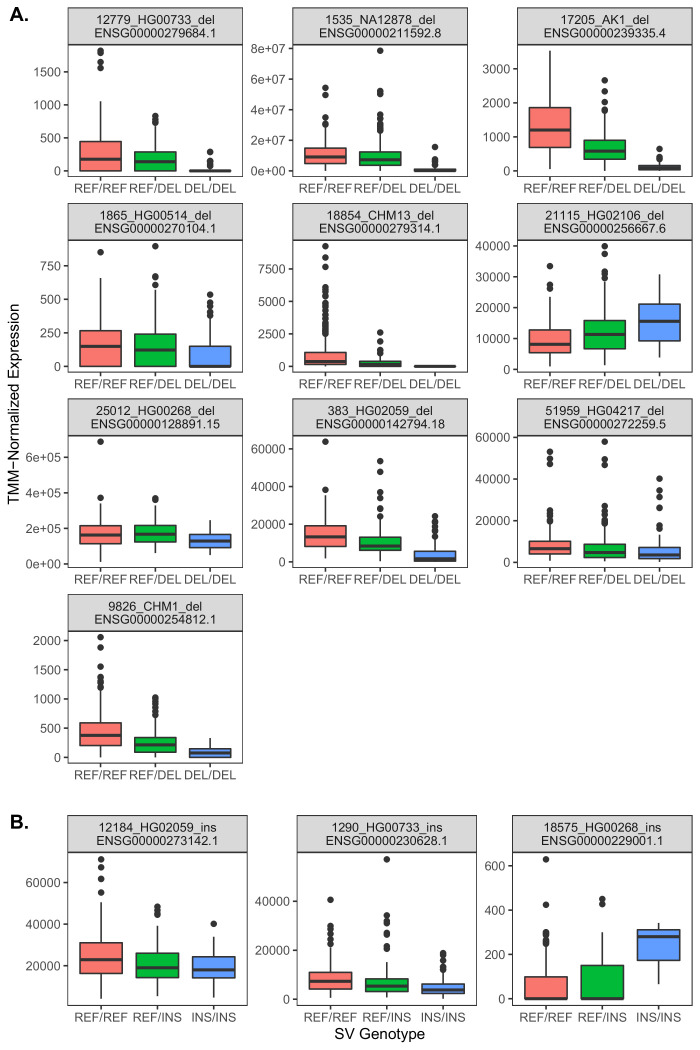
Figure 2—figure supplement 1. Relationships between gene expression and genotype for 13 exon-intersecting SV eQTLs.

Figure 2—figure supplement 1.

(A) Results for deletions, which in eight of nine cases exhibit negative relationships with expression, consistent with direct dosage effects. (B) Results for insertions, which in two cases exhibit negative relationships, but one case exhibits a positive relationship.
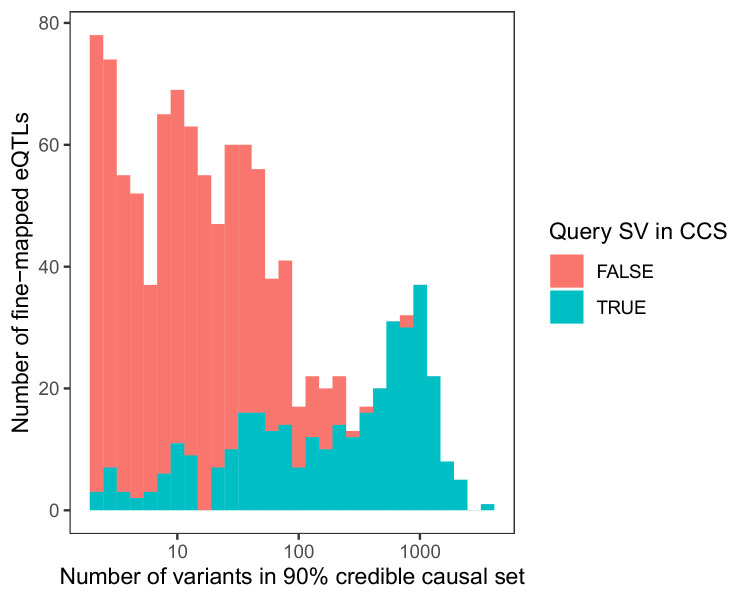
Figure 2—figure supplement 2. Stacked histogram of the number of variants in each 90% credible causal set based on fine-mapping of 1121 significant SV eQTLs with CAVIAR (Hormozdiari et al., 2014).

Figure 2—figure supplement 2.

Loci are colored based on whether the originally associated SV itself occurred within the 90% credible causal set (CCS).