. 2021 Sep 16;10:e67615. doi: 10.7554/eLife.67615

Figure 4. Evidence for Neanderthal introgression of the adaptive IGH haplotype.

(A) Local analysis of likelihood ratio statistics (LRS) in the region near the 33 bp insertion (red point) reveals a 325 kb haplotype encompassing 94 SNPs with strong allele frequency differentiation within ancestry component 2. Points where the alternative allele matches an allele observed in the Chagryskaya Neanderthal genome but at a frequency of 1% or less in African populations are highlighted in purple. (B) Individual haplotypes defined by the highly differentiated SNPs (LRS > 450). Four archaic hominin genomes are plotted at the top, while 30 randomly sampled haplotypes from each of 6 populations from 1KGP are plotted below. Archaic hominins samples are colored according to whether they possess more than one aligned read supporting the alternative allele at a given site. ESN refers to the Esan in Nigeria population of 1KGP. Other 1KGP population codes are provided in the main text.

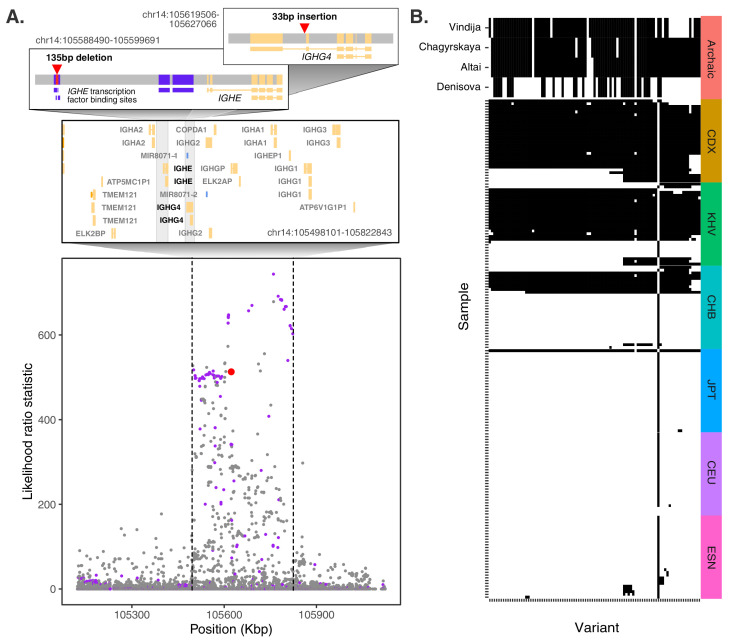
Figure 4.

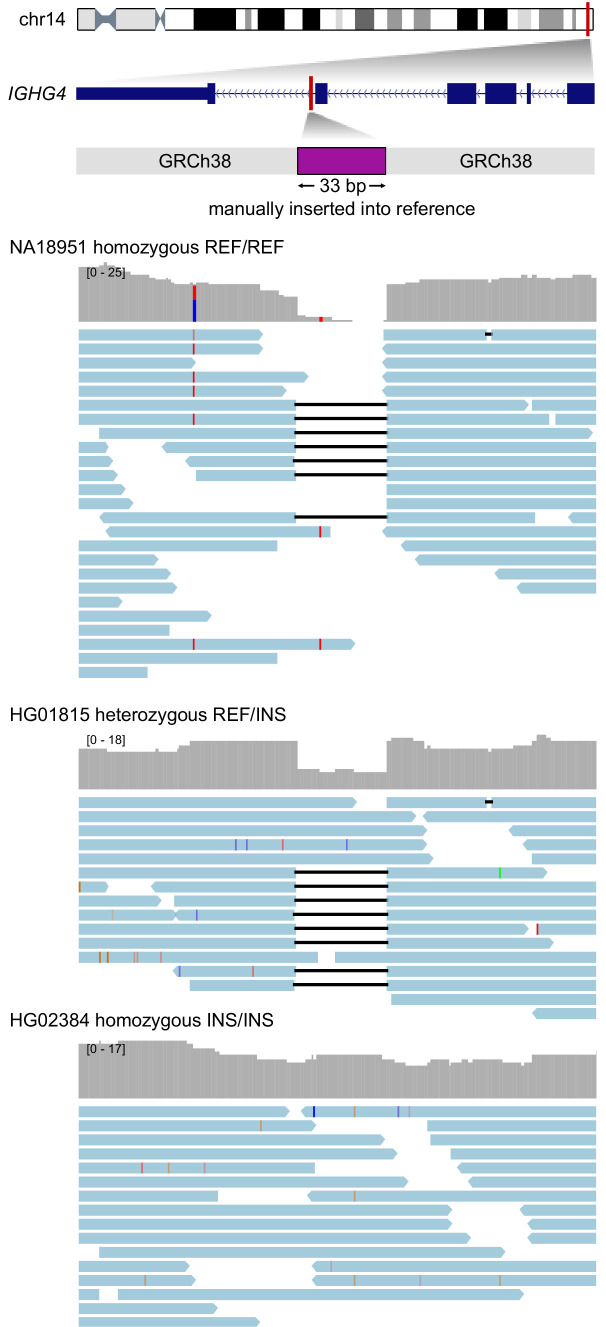
Figure 4—figure supplement 1. Visualization of read alignments to a modified version of the reference genome at the IGHG4 locus including the intronic 33 bp insertion sequence.

Figure 4—figure supplement 1.

Three samples are depicted as representative of each genotype class (homozygous reference, heterozygous, homozygous alternative). Depth of coverage is plotted in upper tracks, while corresponding read alignments are plotted below. Soft-clipped portions of reads were removed to assist visualization.
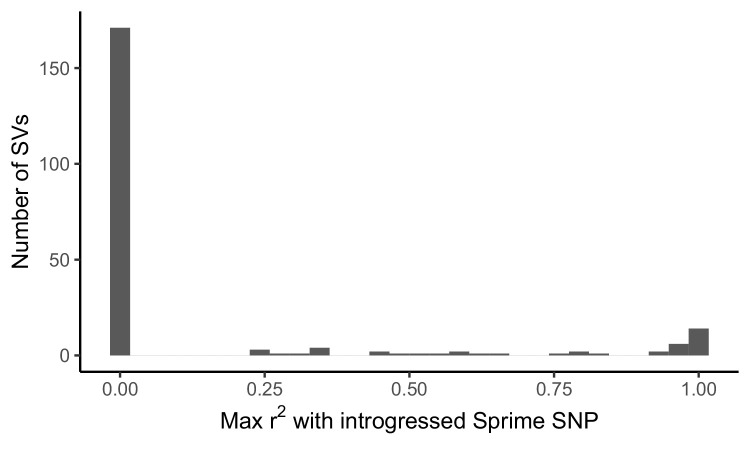
Figure 4—figure supplement 2. Distribution of LD between adaptive SVs and introgressed SNPs called by Sprime.

Figure 4—figure supplement 2.

For the 215 most frequency differentiated SVs in our dataset, we calculated LD between the SV and SNPs defining introgressed haplotypes called by Sprime. LD calculations for each SV were restricted to one 1KGP population, chosen based on the ancestry component where the SV was found to exhibit branch-specific differentiation. We identified 26 candidate adaptively introgressed SVs, which had r2 > 0.5 with an introgressed SNP and were at low frequency (AF < 0.01) within African populations (excluding admixed ASW and ACB populations).
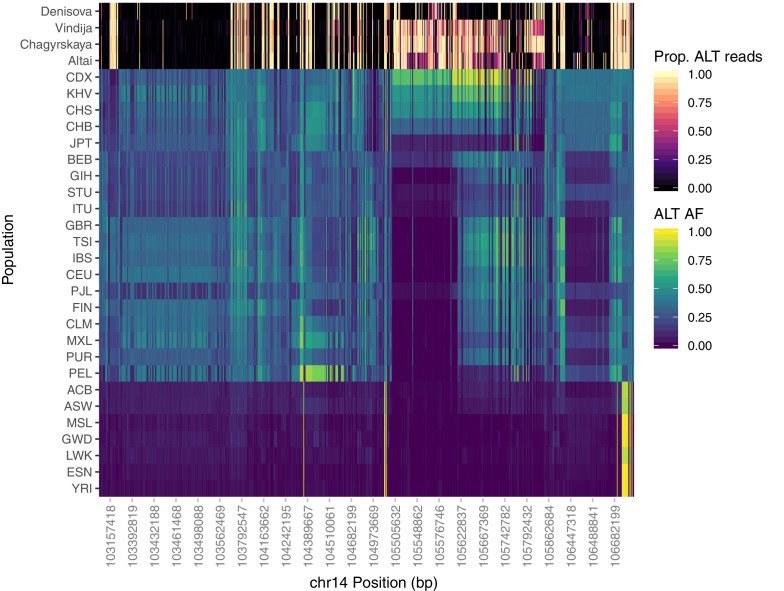
Figure 4—figure supplement 3. Population-specific allele frequencies in the broader IGH region.

Figure 4—figure supplement 3.

The top four rows depict the proportion of aligned reads supporting the alternative allele at each SNP queried for the archaic aDNA samples. The remainder of rows depict the alternate allele frequency of each SNP within each of the 26 populations of 1KGP. Analysis was restricted to SNPs that are rare (MAF < 0.05) among African populations, but common within one or more Eurasian populations (MAF > 0.3).
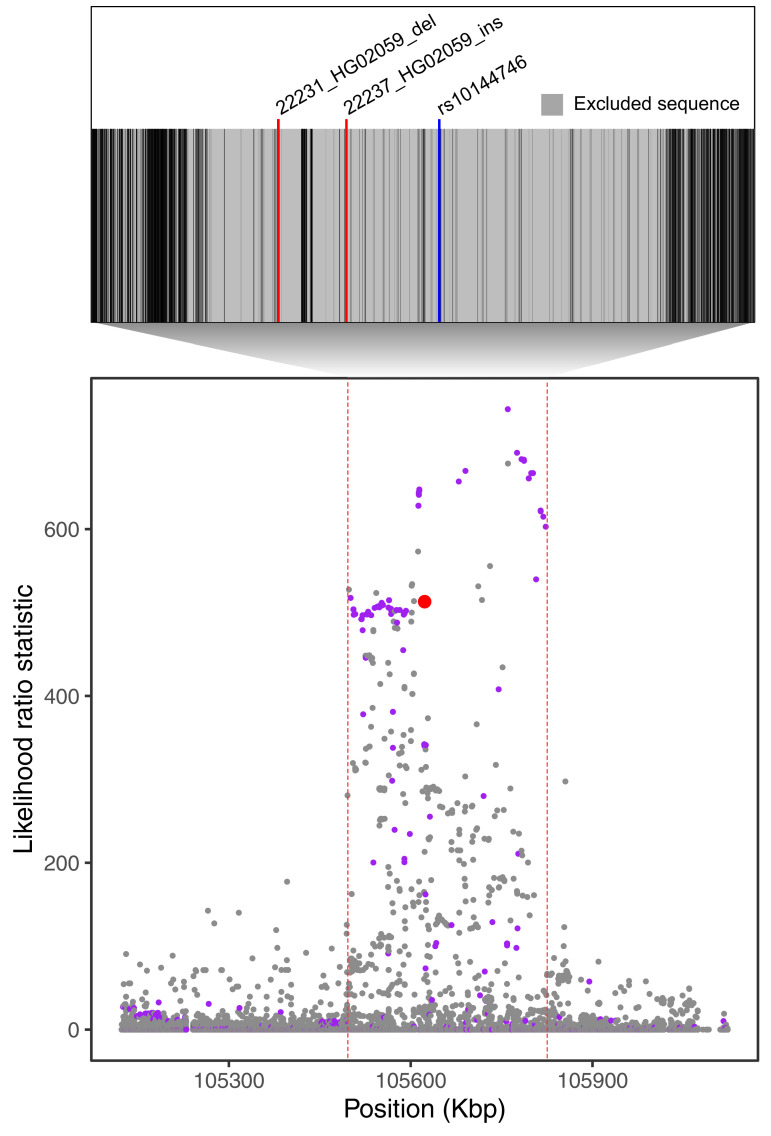
Figure 4—figure supplement 4. Filtering of Neanderthal-introgressed alleles at the IGH locus.

Figure 4—figure supplement 4.

The bottom plot, identical to Figure 4A, shows likelihood ratio statistics (LRS) in the adaptive haplotype around the 33 bp IGHG4 insertion (red dot). The top inset shows the Altai Neanderthal mask (gray), used by Browning et al., 2018 to filter out sites with low-coverage or mapping quality. Positions of the two outlier SVs we identify in this region are represented by red lines. An introgressed SNP highlighted by Browning et al., 2018 is represented by the blue line.
Figure 4—figure supplement 5. Population distribution of IGHG4 insertion using a diagnostic sequence.

Figure 4—figure supplement 5.

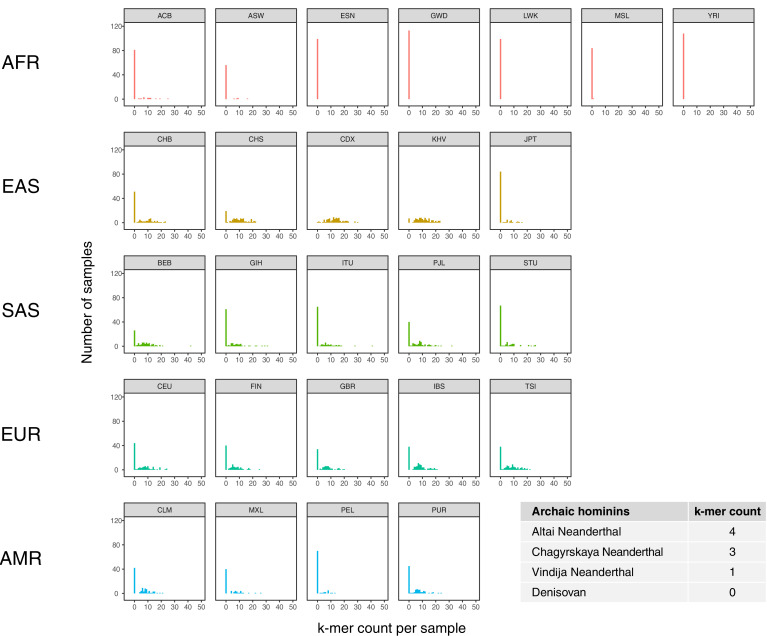
Histograms show counts of a 48 bp sequence that is diagnostic of the 33 bp IGHG4 insertion per individual across the 1KGP dataset, stratified by population. Inset table depicts the counts of the diagnostic sequence in three high-coverage Neanderthal genomes and a high-coverage Denisovan genome.
Figure 4—figure supplement 6. Signatures of archaic introgression based on calls from Sprime.

Figure 4—figure supplement 6.

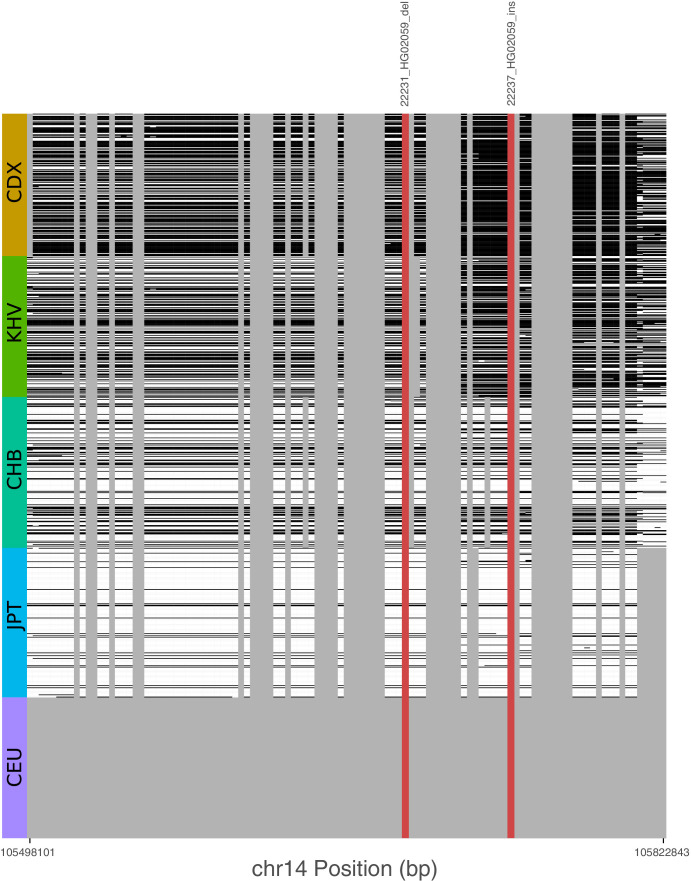
For all variants with likelihood ratio statistic (LRS) > 450 at the IGH locus, we determined whether these variants fell on Sprime-inferred introgressed haplotypes in individuals of each of five 1KGP populations. Gray bars represent variants that were not identified by Sprime as introgressed, including short indels that were not included in the analysis by Browning et al., 2018. Cells are shaded black if the haplotype possesses the putative archaic allele at that variant, and white otherwise. The red bars represent two SVs with the highest LRS in the study.
Figure 4—figure supplement 7. Local LD at the IGH locus.

Figure 4—figure supplement 7.

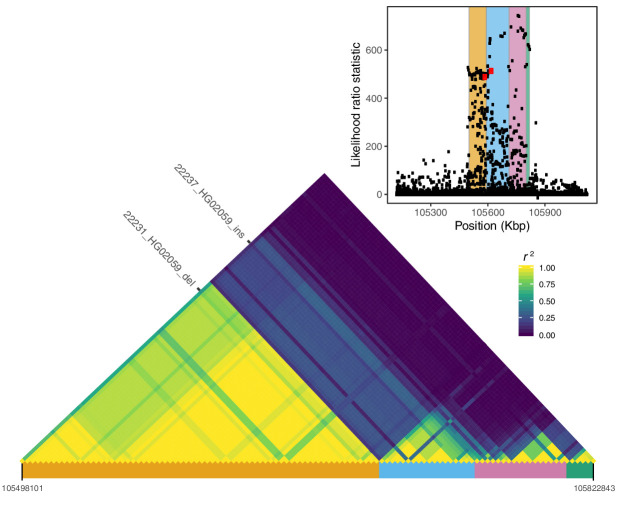
We calculated pairwise LD between all variants with likelihood ratio statistic (LRS) >450 at the IGH locus, including the two SVs with the highest LRS in our study (22231_HG02059_del, 22237_HG02059_ins; red dots in the inset plot). Visualization of this LD matrix revealed at least four distinct blocks of LD, represented as colored rectangles below the LD heatmap and in the inset plot.
Figure 4—figure supplement 8. Global allele frequencies of the introgressed IGH haplotype.

Figure 4—figure supplement 8.

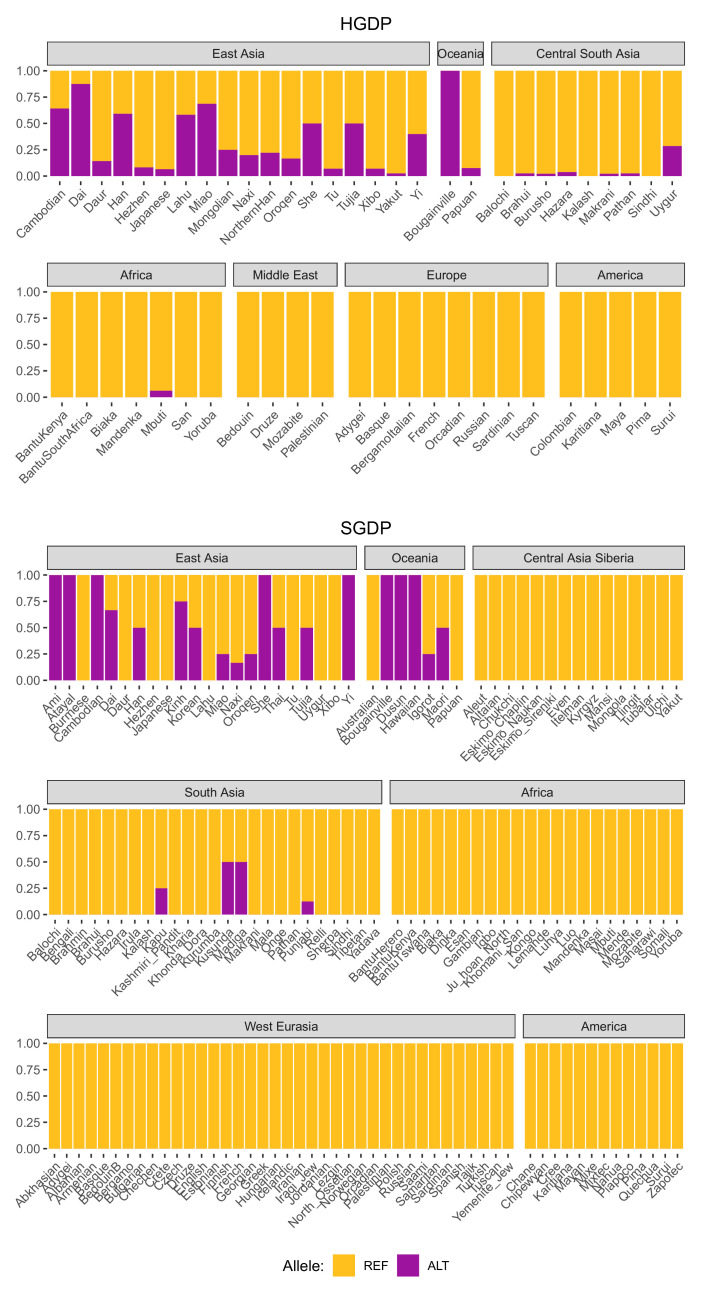
Allele frequencies of rs150526114, a SNP that tags the IGH haplotype and IGHG4 insertion, based on data from the Human Genome Diversity Project (HGDP) and the Simons Genome Diversity Project (SGDP).