. 2021 Sep 16;10:e67615. doi: 10.7554/eLife.67615

Figure 5. Local adaptation at the IGH locus.

(A) Population-specific frequencies of the putative Neanderthal-introgressed insertion allele in each of the 1KGP populations, in the style of the Geography of Genetic Variants browser (Marcus and Novembre, 2017). (B) Tree representation of the best-fit selection hypothesis for Neanderthal-introgressed haplotype tagged by the IGHG4 insertion polymorphism, as computed by Ohana. (C) Five-population demographic model used for simulation and parameter inference via approximate Bayesian computation (ABC). Population sizes and split times are further described in Materials and methods. (D) Posterior distribution of the selection coefficient (s). (E) Posterior distribution of the timing of the onset of selection (Tadaptive). (F) Posterior distribution of the initial allele frequency at the beginning of the simulation (p0). (G) Negative relationship between s and Tadaptive for simulations retained by ABC.

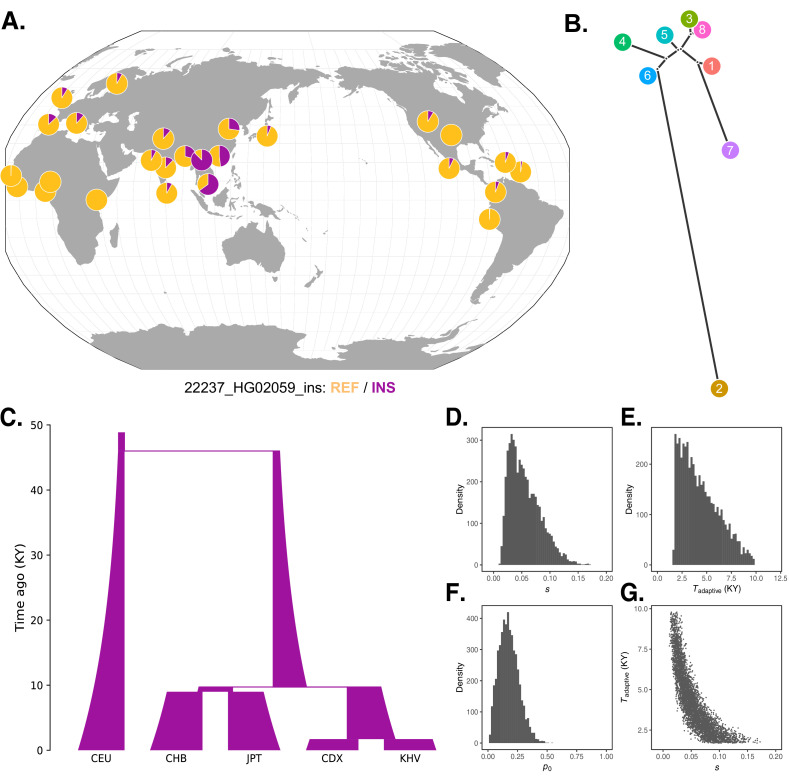
Figure 5—source data 1. Parameters and summary statistics for the simulations retained in the ABC analysis, underlying Figure 5D–G.
Simulation parameters are provided in the first three columns. Population-specific allele frequencies output by the simulation are provided in the last five columns, labeled by their corresponding 1KGP population codes.

Figure 5.

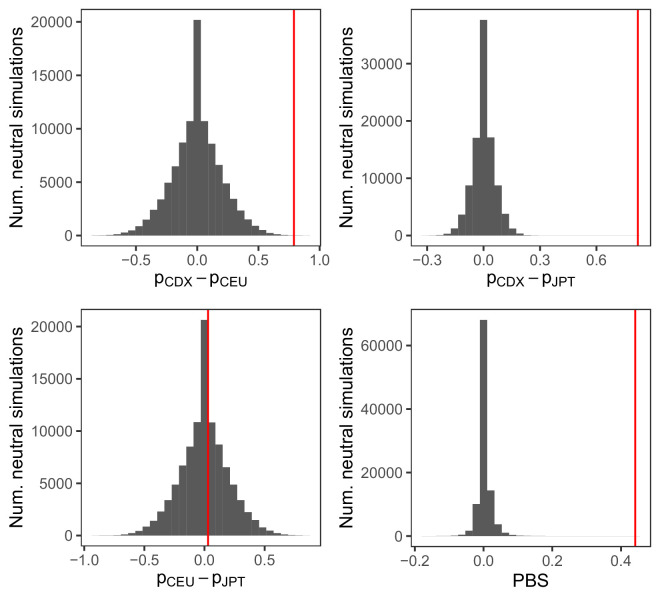
Figure 5—figure supplement 1. Distribution of FST and population branch statistic (PBS) for the IGHG4 insertion from 100,000 neutral simulations.

Figure 5—figure supplement 1.

PBS was calculated between the Chinese Dai (CDX), Northern Europeans from Utah (CEU), and Japanese (JPT) populations, as TCDX-CEU+TCDX-JPT-TCEU-JPT2 . The red vertical lines represent the observed pairwise allele frequency differences and PBS for the insertion allele.
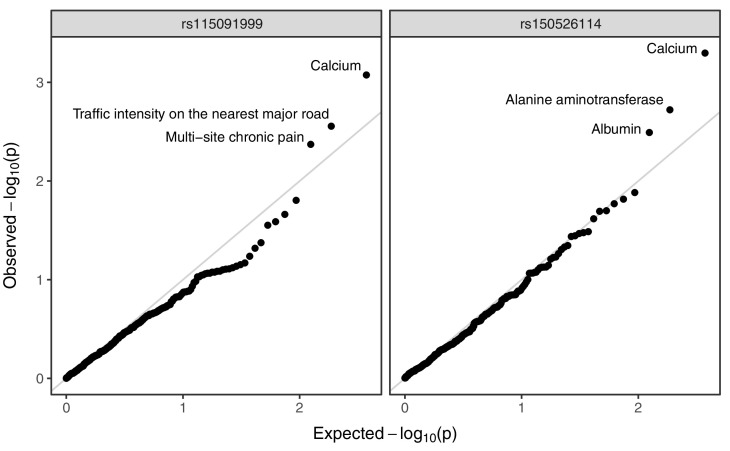
Figure 5—figure supplement 2. Annotated Q–Q plot from a phenome-wide association analysis of putative Neanderthal-introgressed variants at the IGH locus, using summary statistics from East Asian individuals from the pan-ancestry GWAS of the UK Biobank dataset.

Figure 5—figure supplement 2.

SNP rs115091999 (left panel) tags 22231_HG02059_del, while rs150526114 (right panel) tags 22237_HG02059_ins within the CDX population. No phenotype association is significant after multiple testing correction (Bonferroni-adjusted p-value > 0.05).