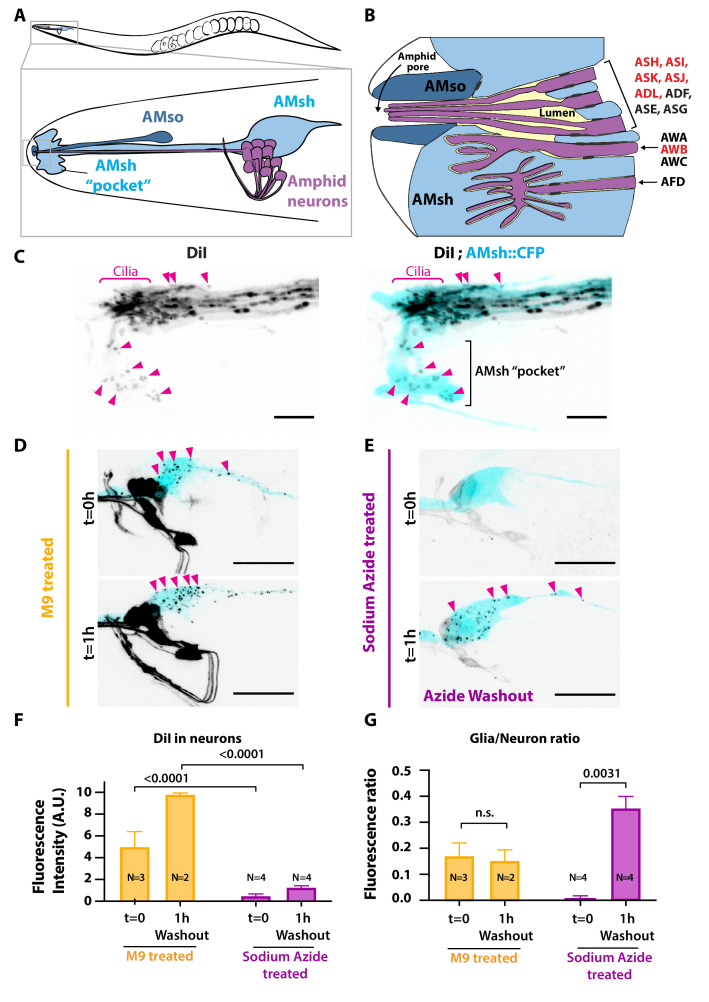
Figure 1. Ciliated amphid neurons transfer DiI-stained membrane to the ensheathing glia in an ATP-dependent manner within minutes.
(A) Anatomical organization of the amphid sensilla in C. elegans (top). Head close-up scheme shows AMsh and AMsh ‘pocket’ (light blue), AMso (dark blue), and the amphid neurons (magenta). (B) Schematic depicting the nerve receptive ending (NRE) of the 12 amphid neurons. Tight junctions between neurons and glia, or between AMsh and AMso, are depicted as dark gray discs between cells. The red labeled neurons are the DiI-stained subset. (C) Maximum intensity projection of the DiI-stained neurons in a strain expressing CFP in AMsh glia. Neuronally derived vesicles containing DiI can be observed within the AMsh cytoplasm and in the AMsh ‘pocket’ (magenta arrowheads) (D) DiI staining of the amphid neurons treated with M9 at t = 0 and after 1 hr of being washed with M9, amphid neurons strongly stained, and multiple vesicular puncta within AMsh cell body can be observed (magenta arrowheads). (E) In the presence of 25 mM sodium azide, DiI staining of the amphid neurons is fainter and no vesicles could be observed within AMsh cell body at t = 0. After 1 hr of being washed with M9 to remove sodium azide (azide washout), the AMsh staining is recovered. (F) Measurements of fluorescence intensity (in arbitrary units) quantified in neuronal cell bodies. Two-way ANOVA, Sidak’s correction for multiple comparison. (G) Glia/neuron fluorescence ratios. Glia fluorescence was normalized to the fluorescence intensity of neurons. AMsh normalized fluorescence is drastically reduced in the presence of sodium azide and increases after its removal (t = 1 hr). Unpaired t-test with Welch’s correction. Scale bars: 5 μm in (C), 20 μm in (D, E).


