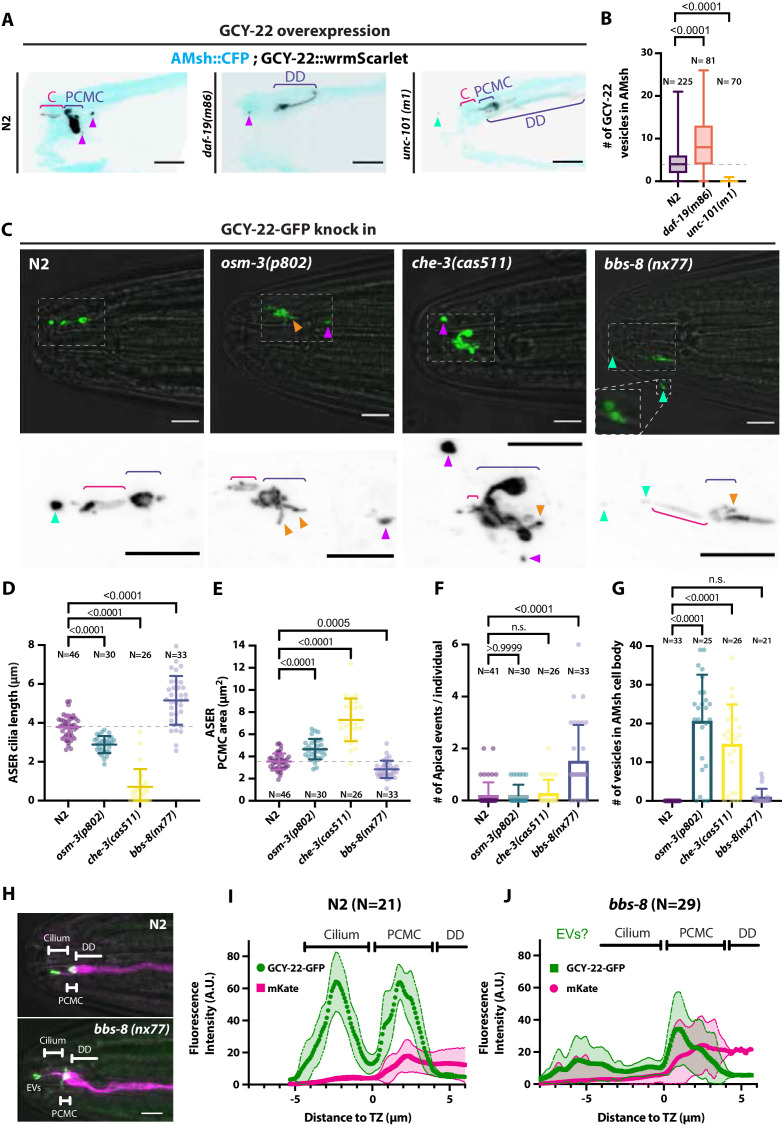
Figure 4. Ectocytosis of GCY-22-wrmScarlet is increased in daf-19, osm-3, che-3, bbs-8 but reduced in unc-101 mutants.
(A) Representative images depicting overexpressed GCY-22-wrmScarlet distribution in ASER ciliary region for N2, daf-19, and unc-101. In N2, overexpressed GCY-22-wrmScarlet accumulated in the cilium (C) and in the periciliary membrane compartment (PCMC); however, it was absent from distal dendrite (DD). In daf-19 mutants, ASER cilium was missing. GCY-22-wrmScarlet accumulated in an elongated ectopic compartment arising from ASER DD, an EV was observed in its vicinity within AMsh cytoplasm (magenta arrowhead). In unc-101 mutants, GCY-22-wrmScarlet was observed weakly along ASER DD membrane, PCMC, and cilium with no enrichment in cilium. The ASER cilium was shorter. We observed one extracellular vesicle (EV) outside the animal (cyan arrowheads). Scale bar: 5 μm. (B) Number of large ectosomes containing GCY-22-wrmScarlet within AMsh cell. Box and whiskers plot represents their median number, the interquartile range, and the min/max values in N2, daf-19, and unc-101. The number of vesicles was increased in daf-19 and decreased in unc-101 mutants. Brown–Forsythe ANOVA, multiple comparisons corrected by Dunnett´s test. (C) In GCY-22-GFP knocked in strain in N2 background, GCY-22-GFP accumulated in the cilium and PCMC. In osm-3, GCY-22-GFP accumulated in ASER PCMC. PCMC shape was disrupted and displayed multiple protrusions (orange arrowheads). We observed more EVs in AMsh in the vicinity of ASER cilium (magenta arrowhead). In che-3, the ASER cilium proper was strongly shortened. GCY-22-GFP strongly accumulated in heavily disrupted PCMC displaying multiple protrusions filled with GCY-22-GFP. In bbs-8 mutants, we observed more EVs in the amphid pore and outside (cyan arrowheads). ASER PCMC displayed abnormal shapes and often display protrusions. Scale bars: 5 μm. (D) The ASER cilium length was evaluated based on GCY-22-GFP staining of the cilium in 2D projections. Cilia length is shortened in osm-3 and che-3 and elongated and variable in bbs-8 mutants. Brown–Forsythe ANOVA, multiple comparisons corrected by Dunnett´s test. (E) PCMC is increased in osm-3 and che-3 and reduced in bbs-8 mutants. Brown–Forsythe ANOVA, multiple comparisons corrected by Dunnett´s test. (F) The number of apical EVs observed in each animals shows apical release occurs in N2, osm-3, and che-3 but is potentiated in bbs-8 mutant. Brown–Forsythe ANOVA, multiple comparisons corrected by Dunnett´s test. (G) The number of EVs observed in AMsh for each animal shows that basal release does not occur in N2. The number of EVs observed AMsh is increased in osm-3 and che-3 mutants. Kruskal–Wallis test, multiple comparisons corrected by Dunn´s test. (H) Fluorescence along the cilia was quantified in animals carrying GCY-22-GFP knock-in in N2 and bbs-8 genetic background and an extrachromosomal for expression of mKate in ASER. Scale bar: 5 μm. (I) Linescans were traced for 21 N2 cilia and aligned on the transition zone based on drop in mKate signal. Average fluorescence standard deviation is plotted for mKate and GCY-22-GFP fluorescence intensities. It shows the accumulation of GCY-22-GFP fluorescence in PCMC and distal cilia. (J) Linescans were traced for 29 bbs-8(nx77) cilia and aligned on the transition zone based on drop in mKate signal. Average fluorescence standard deviation is plotted for mKate and GCY-22-GFP fluorescence intensities. It shows reduced GCY-22-GFP fluorescence along the cilia of bbs-8(nx77) and a highly variable distal cilia, representing elongated cilia, cilia with EVs attached to it, and EV detached from cilia.

