. 2021 Sep 17;10:e67670. doi: 10.7554/eLife.67670

Figure 5. Ectocytosis of TSP-6-wrmScarlet to AMsh is increased in osm-3, che-3, and bbs-8 while ectocytosis of TSP-6-wrmScarlet to the amphid pore and outside is increased in bbs-8.

(A) In TSP-6-wrmScarlet knocked in strain in N2 background, TSP-6-wrmScarlet accumulated in the cilium and periciliary membrane compartment (PCMC) of the channel amphid neurons (Inset) as well as in AWC and AWA cilia. Several extracellular vesicles (EVs) were observed in amphid channel (cyan arrowheads). Left panel, scale bar: 5 μm. TSP-6-wrmScarlet was also observed in EVs located within the AMsh cytoplasm (magenta arrowheads). Right panel, scale bar: 20 μm. (B) In osm-3, TSP-6-wrmScarlet accumulated in PCMCs area (delimited by dashed magenta line). We observed more EVs in AMsh cell body (magenta arrowhead). The location of amphid neurons cell bodies is delimited by a black dashed line. (C) In che-3, TSP-6-wrmScarlet strongly accumulated in PCMCs. We observed more EVs in AMsh cell body (magenta arrowhead). (D) In bbs-8 mutants, we observed more EVs in the amphid pore (cyan arrowheads) and in the AMsh cell body (magenta arrowheads). (E) The number of apical EVs observed in each animals shows that apical release occurs in N2, osm-3, and che-3. Apical release is potentiated in bbs-8 mutants. Brown–Forsythe ANOVA, multiple comparisons corrected by Dunnett´s test. (F) The number of EVs observed in AMsh for each animals shows that TSP-6-wrmScarlet export to AMsh occurs in N2. This number of EVs observed AMsh is increased in osm-3, che-3, and bbs-8 mutants. Brown–Forsythe ANOVA, multiple comparisons corrected by Dunnett´s test.

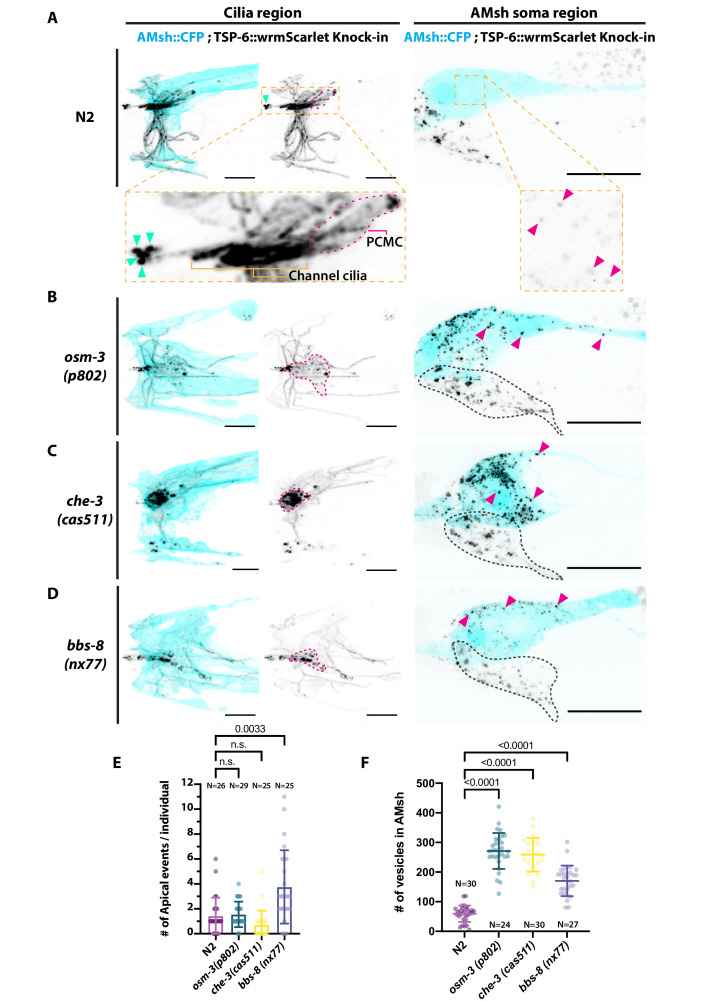
Figure 5.

Figure 5—figure supplement 1. (A) Expression pattern of TSP-6-wrmScarlet in gene-edited strain and export of TSP-6-wrmScarlet to AMsh.

Figure 5—figure supplement 1.

Focusing on the amphid channel area, we observed a strong staining of the amphid channel neurons as well as staining typical of AWA branched cilia and AWC wing cilia. Extracellular vesicles (EVs) released outside (cyan arrowheads) and EVs released to AMsh (magenta arrowheads) are highlighted. (B) Expression of tsp-6 predicted from single-cell RNA sequencing studies (Lorenzo et al., 2020; TPM: transcripts per million) suggests that tsp-6 is expressed strongly in ASK and more weakly in ASJ, ASH, ADL, ADF, ASG, ASI, ASER, AWA, and AWC. (C) Export of TSP-6-wrmScarlet was quantified by counting the number of EVs observed in AMsh close to the cilia region in each animal. It shows the number of EVs observed in distal AMsh is also increased in osm-3, che-3, and bbs-8 mutants compared to N2. Brown–Forsythe ANOVA, multiple comparisons corrected by Dunnett´s test. (D) EV fluorescence intensity within the AMsh region was quantified in each animal and strain. It shows that the total amount of TSP-6-wrmScarlet exported to AMsh is increased in osm-3, che-3, and bbs-8 mutants compared to N2. Brown–Forsythe ANOVA, multiple comparisons corrected by Dunnett´s test.
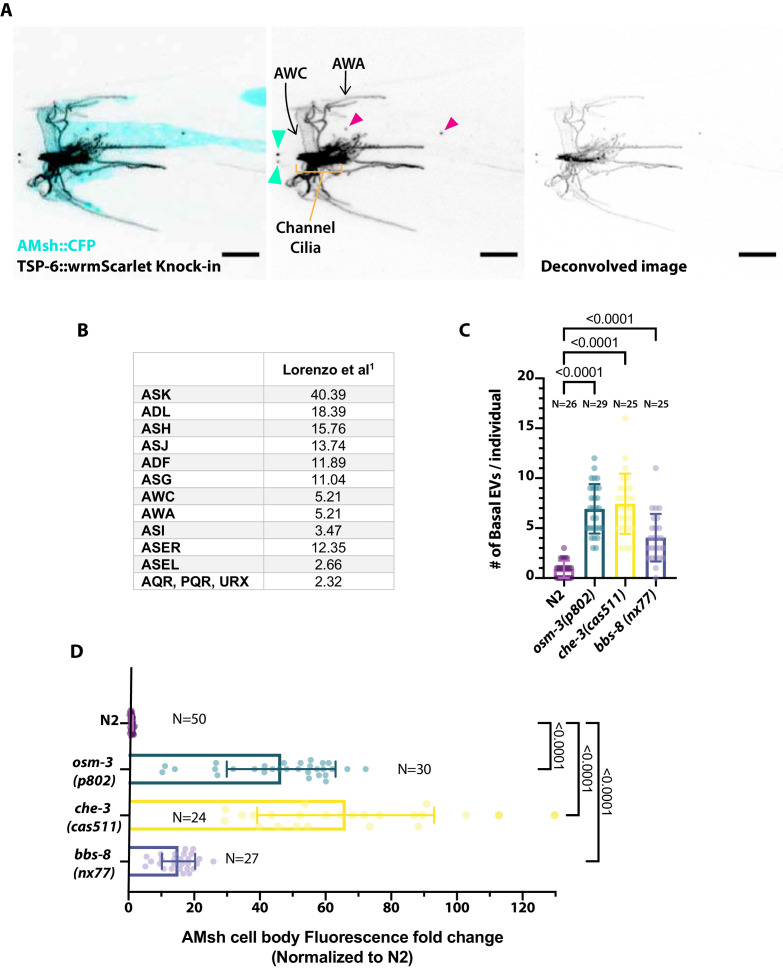
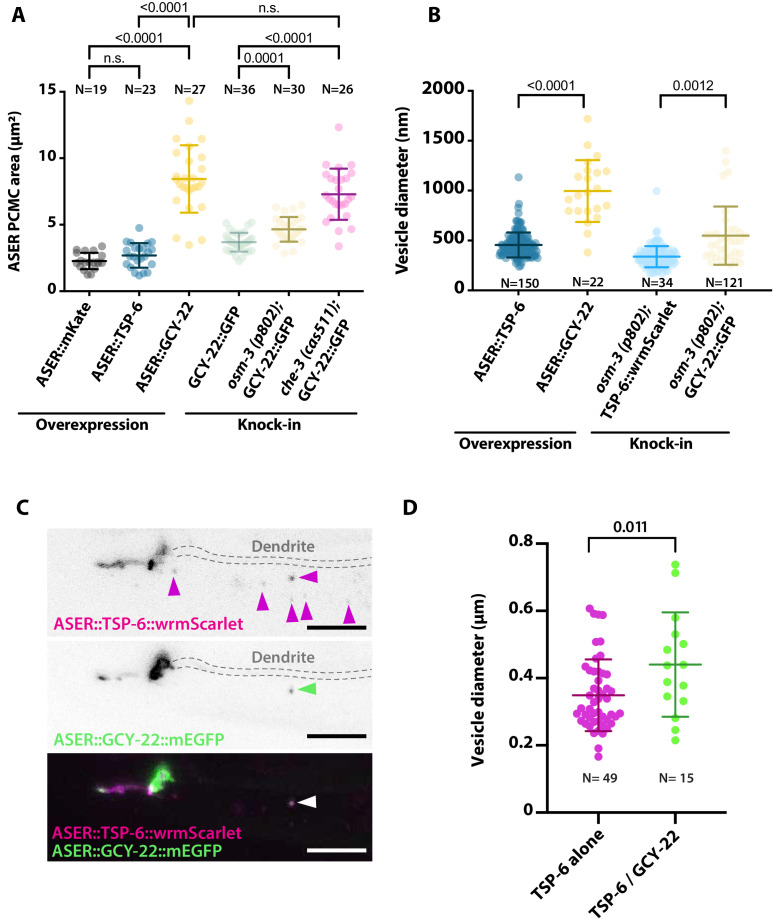
Figure 5—figure supplement 2. Periciliary membrane compartment (PCMC) and ectosome size are influenced by expression of TSP-6 and GCY-22.

Figure 5—figure supplement 2.

(A) The PCMC area of ASER is enlarged by overexpression of GCY-22-wrmScarlet compared to the overexpression of cytoplasmic mKate or TSP-6-wrmScarlet. The size might be partially influenced by staining of the plasma membrane versus cytoplasm. For comparison, we display ASER PCMC enlargement observed in GCY-22-GFP knock-in strain in osm-3 and che-3 backgrounds. Brown–Forsythe ANOVA, multiple comparisons corrected by Dunnett´s test. (B) The diameter of exported extracellular vesicles (EVs) from ASER differs between TSP-6-wrmScarlet and GCY-22-wrmScarlet-containing vesicles in both overexpression strains and knocked in strains. Vesicles were only measured in the vicinity of ASER cilium. Brown–Forsythe ANOVA, multiple comparisons corrected by Dunnett´s test. (C) ASER cilium co-expressing TSP-6-wrmScarlet and GCY-22-mEGFP showed that both markers were enriched in ASER cilia, but their localization within ASER cilia was poorly correlated (r = 0.378 using Pearson’s coefficient, N = 10). Most of the ASER-derived vesicles observed in AMsh surroundings cilium carried TSP-6-wrmScarlet alone (65%, N = 10 animals, magenta arrowheads), 16% of vesicles carried TSP-6-wrmScarlet together with GCY-22-mEGFP (N = 10 animals, green arrowhead), and the remaining 19% carried GCY-22-mEGFP alone (N = 10 animals). Scale bar: 5 μm. (D) Vesicle diameter differences are observed for vesicles carrying TSP-6-wrmScarlet alone or TSP-6-wrmScarlet together with GCY-22-EGFP. All vesicles in these figures were measured in the vicinity of ASER cilium, representing recent ectocytic events. Unpaired t-test with Welch’s correction.