
Figure 6.
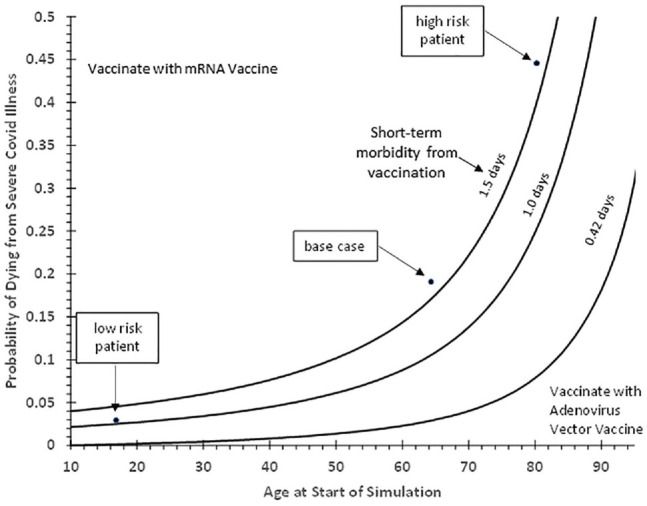
Three-way sensitivity analysis of age, probability of dying from severe COVID-19 disease, and short-term morbidity from vaccination. The age of patients at the start of the Markov simulation is shown on the x-axis, while the probability of dying from severe COVID-19 illness is shown on the y-axis. The three curves depict the thresholds between the two vaccine strategies for different values of short-term morbidity from vaccination, the base case value of 0.42 days (bottom right), 1 day (middle curve), and 2 days (curve at the upper left). Along each threshold line, the difference in expected utility between both strategies is zero. Above the lines, in the region emanating from the upper left, in which patients are younger and the probability of death from severe COVID-19 illness is higher, Vaccinate with an mRNA Vaccine is best. In the region emanating from the lower right, in which patients are older the risk of dying from severe COVID-19 illness is lower, Vaccinate with the AVV is best. The region to the bottom right, in which AVV is best gets larger as the short-term morbidity associated with each vaccine dose increases. Three clinical scenarios are highlighted, including the base case (otherwise healthy 65-year-old), a high-risk patient (age ≥80 years with multiple comorbidities), and a low-risk patient. All fall within the region in which an mRNA vaccine is preferred at the base case value for vaccine morbidity. Note, a >80-year-old patient with no other comorbidities has a calculated mortality risk of 26.3% (not shown in figure).