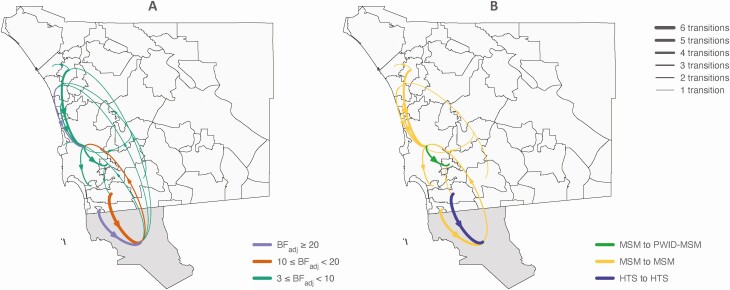
Figure 1.
Lineage dispersal events between locations (ie, San Diego communities and the city of Tijuana) and between risk groups. A) The thickness of the arrows reflects the average number of inferred migration events between locations, and the color of the arrows indicates the corresponding BFadj support. B) For all migration events between locations with BFadj ≥3, the thickness of the arrows reflects the average number of inferred migration events within or between risk groups, and the color of the arrows indicates the group mixing patterns. Results were obtained from discrete models including clades with SH branch support ≥0.9. Tijuana is colored in darker gray. See also Supplementary Figure S5 for results from discrete models including clades with SH branch support ≥0.7. Abbreviations: BFadj, adjusted Bayes factor; HTS, heterosexual; MSM, men who have sex with men; PWID, people who inject drugs; SH, Shimodaira Hasegawa.

