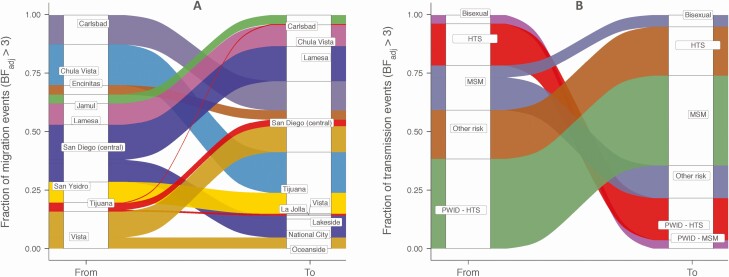
Figure 2.
(A) Relative contribution of the various migration links to the spread of HIV-1 subtype B in the San Diego–Tijuana area and (B) the relative contribution of risk groups to the spread of HIV-1 B in San Diego and the city of Tijuana. A) We present the results from the discrete phylogeographic analysis including clades with SH support ≥0.9. The Sankey plot represents the average proportion of migration events from each source location (“from”) toward the recipient location (“to”). The left side of the plot shows the origin location, and the right side of the plot shows the destination location. We here only report migration events associated with a BFadj support ≥3. All corresponding BFs are presented in Table 1. B) Results are based on the clade identification using SH branch support ≥0.9 and accounting for migration links associated with a BFadj ≥3. The Sankey plot represents the proportion of migration events from each source risk group (“from”) toward the recipient risk group (“to”). Results from the discrete phylogeographic reconstruction based on clades with SH support ≥0.7 are presented in Supplementary Figure S3. All corresponding BFs are presented in Table 1. Colors were chosen to visually clearly distinguish the different types of migration events and have no specific meaning. Abbreviations: BF, Bayes factor; BFadj, adjusted Bayes factor; HIV, human immunodeficiency virus; HTS, heterosexual; MSM, men who have sex with men; PWID, people who inject drugs; SH, Shimodaira Hasegawa.

