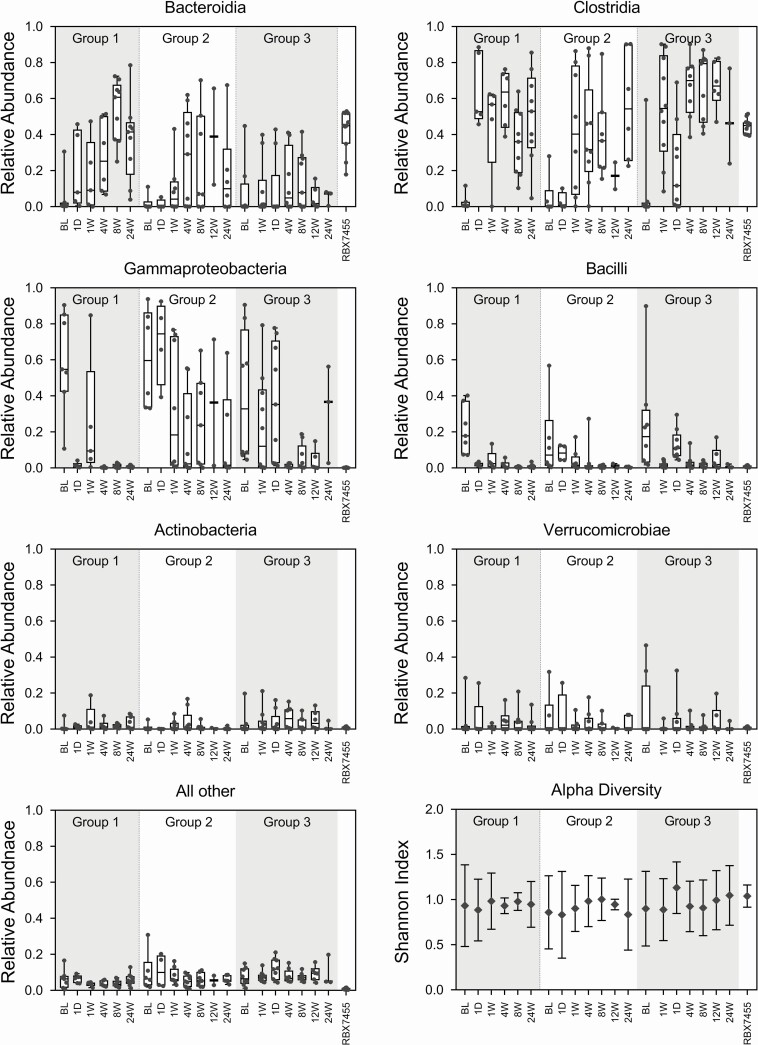
Figure 3.
Taxonomic compositions at the class level and alpha diversity of responder microbiomes and RBX7455. Relative abundance data are shown in box-and-whiskers format, and alpha diversity is shown as a mean with standard deviations. Classes with <5% total relative abundances are groups together as “Other”.

