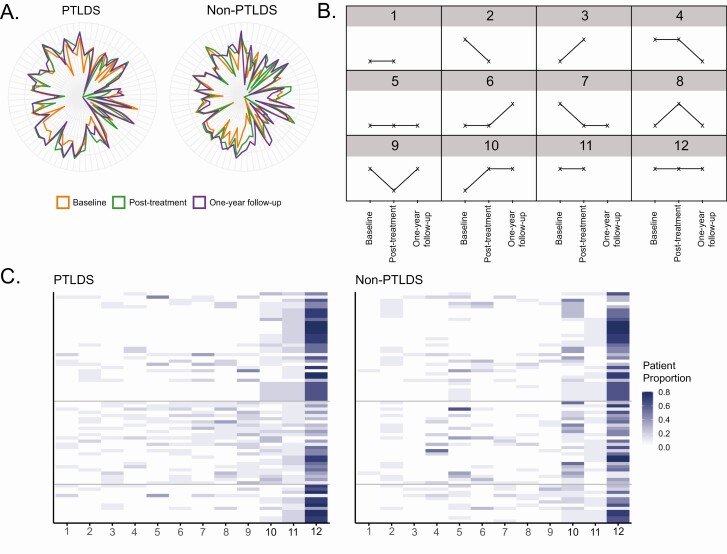
Figure 3.
Analysis of SMM longitudinal behavior in PTLDS and non-PTLDS patients. A, Radar plots using the 72 SMMs selected by elastic net overlaid for all 3 time points. PTLDS patient measurements are depicted on the right, and non-PTLDS patient measurements are depicted on the left. The colors for each time point are orange, green, and purple for baseline, post-treatment, and 1-year follow-up, respectively. B, Diagram of the 12 longitudinal patterns observed for the 72 SMMs selected using elastic net regularization. Higher points indicate a log10 SMM abundance greater than −10; lower points indicate log10 abundance less than −10; missing points indicate a patient sample was not available. C, Heatmaps depicting the proportion of patients who displayed each of the 12 patterns for the 72 SMMs in the PTLDS patient group (left) and the non-PTLDS patient group (right). The columns are ordered from right to left according to the proportion of PTLDS patients (low to high). The SMMs are ordered according to their Rényi diversity groups with lines separating each group; the 34 SMMs with no clear difference in diversity between the groups (top), the 26 SMMs that are clearly more diverse in PTLDS patients (middle), and the 12 SMMs that are clearly more diverse in non-PTLDS patients (bottom). Abbreviations: PTLDS, post-treatment Lyme disease symptoms/syndrome; SMM, small-molecule metabolite.

