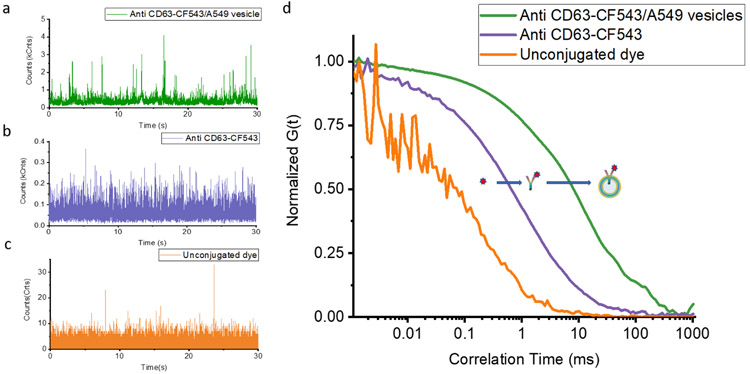
Figure 2.
Demonstration of the ability of FCS to measure fluorescent molecules over a different size range. The recorded fluorescence fluctuations over time from immunofluorescently labeled A549 cell-derived vesicles (a), fluorescent antibody (b), and unconjugated dye(c). d is the corresponding measured normalized ACF curves from a, b, and c.

