Figure 5.
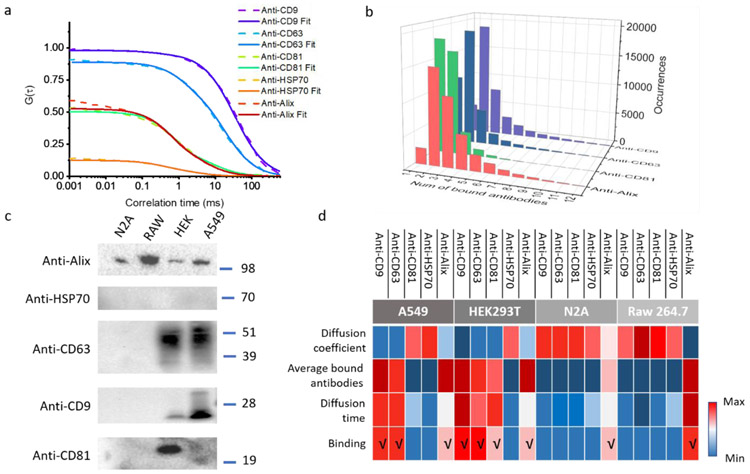
ht-FCS studies of immunofluorescently labelled vesicles. a and b are results from 5 different antibodies labeled HEK cell derived vesicles. a, the experimental and fitted autocorrelation functions clearly show a difference in the diffusion time and thus show the expression level of different proteins in the vesicle surface. b, Histogram of the calculated number of bound antibodies per HEK cell derived vesicles. c, validation of selected exosomal marker proteins by immunoblotting. d, color table of antibody binding analysis among 4 different cell-derived vesicles.

